Amherst, TX, USA apartments for sale
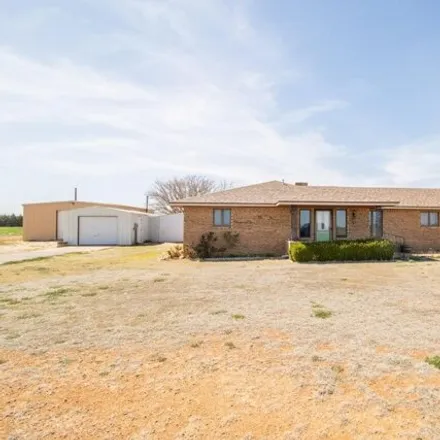
$275,000
$275,000
Available: Right Now
Welcome home ! This amazing 3 bedroom 2 bath home out in Amherst, TX has everything you are looking for! Indoors you will love the inviting kitchen/dining area, spacious living area which features a gorgeous wood-burning fireplace, amazing bed...
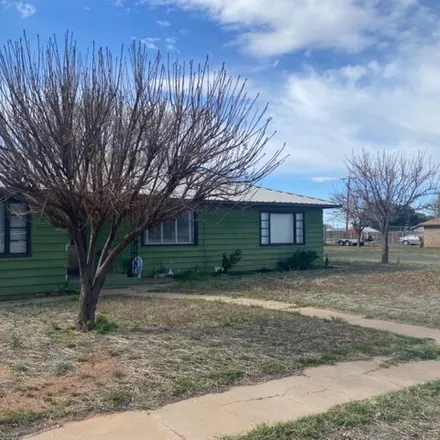
$90,000
$90,000
Available: Right Now
Welcome to a well maintained three spacious bedroom and two bathroom home, with a spacious living area, and an isolated master bedroom. Fantastic yard for gardening, playground setting, and even a sandbox setting in a peaceful neighborhood. Close to ...
Amherst
According to statistics, the population in Amherst, TX amounts to 811, which shows growth 3% compared to the previous year. The median age of the city’s residents is 46. The average household income is $46,771, shifting growth 5% from the past year, and the average property value in Amherst, TX growth 4% to $52,100 throughout the year.
| Population | 811 |
| Median Age | 45.9 |
| Poverty Rate | 23% |
| Household Income | $46,771 |
| Number Of Employees | 334 |
| Median Property Value | $52,100 |
What is the Average Price of Apartments for Sale in Amherst, TX?
| Month | Median Price |
|---|---|
| Mar 2024 |
$388,753
|
| Feb 2024 |
$388,753
|
| Jan 2024 |
$388,753
|
| Dec 2023 |
$388,753
|
| Nov 2023 |
$424,981
|
| Oct 2023 |
$465,265
|
Household Income
The average household income in Amherst, TX grew from $44,342 to $46,771 in the past year. This data is an estimate based upon 283 households in Amherst, TX . The chart below presents how household income is distributed in Amherst, TX in comparison to the revenue allocation amid households nationally.
Property Value
According to data from last year, the average property value in Amherst, TX shifted from $50,200 to $52,100 throughout the year. The subsequent graph indicates the share of properties in the given price range in Amherst, TX in comparison to the median property value in the same price segment across the country. According to the data, the greatest share of Amherst, TX properties falls in the '$50,000 to $59,999' range, which is lower than the most significant median property across the country.
Rent vs. Own
Property Taxes
One of the most important aspects for property owners is the amount of property taxes. This graph shows distribution of property taxes in Amherst, TX compared to median property taxes around the country. The prevalent amount of property taxes in Amherst, TX equals $800, which is less than the national average.