Barrett, TX, USA apartments for sale
$243,240
$243,240
Available: Right Now
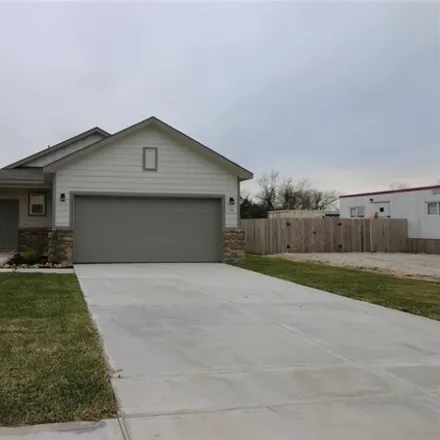
With 1388 Square feet, the Hartford plan is a 3 bedroom/2 bath with the following features included: Large Island, 42 Maple Kitchen Cabinets, Stainless Steel Appliances that include Whirlpool gas range, microwave oven that is vented outside and dishw...
$899,000
$899,000
Available: Right Now
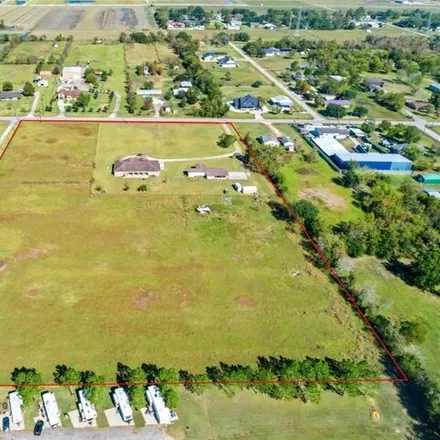
Welcome to country living, so close to the city! Enjoy the serenity of 10 unrestricted acres! ( 9 acres fenced) Property currently has an AG exemption . no mud. no hoa here. No Water bill . low taxes ! No Flooding ever! Enjoy sitting on...
$235,990
$235,990
Available: Right Now
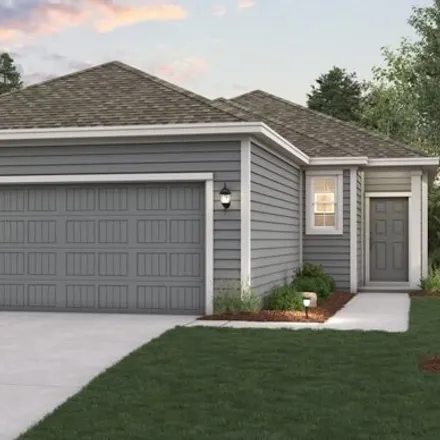
With 1288 Square feet, the Williamsburg plan is a 3 bedroom/2 bath with the following features included: NO back neighbors. Large Island, 42 Maple Kitchen Cabinets with Crown Molding , Stainless Steel Appliances that include Whirlpool gas range, micr...
$246,990
$246,990
Available: Right Now
With 1288 Square feet, the Williamsburg plan is a 3 bedroom/2 bath with the following features included: NO back neighbors. Large Island, 42 Maple Kitchen Cabinets with Crown Molding , Stainless Steel Appliances that include Whirlpool gas range, micr...
$205,000
$205,000
Available: Right Now
No hoa, no hoa, no hoa ! Discover your dream home in this beautifully updated property featuring brand new luxury vinyl plank (LVP) flooring and fresh paint throughout. The brand new privacy fence creates a secluded oasis in the backyard, perf...
$209,900
$209,900
Available: Right Now
Welcome to your new abode! Tucked away in the picturesque Arcadia Gardens neighborhood, this splendid 3-bedroom home is a true treasure. Upon entry, you'll be greeted by the charm of exquisite hardwood and tile flooring that seamlessly adorns every c...
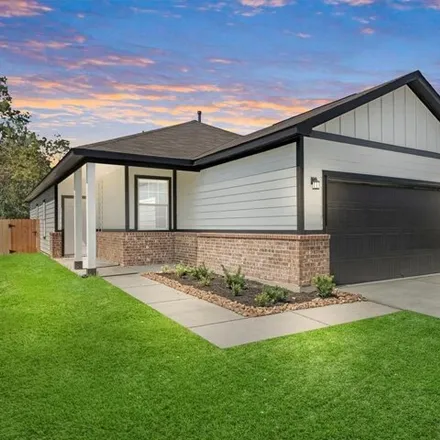
$269,990
$269,990
Available: Right Now
The Lexington Floorplan. -With 1785 Square feet, the Lexington plan is a 4 bedroom/2.5 bath with the following features included: Large Island, 42 Maple Kitchen Cabinets with Crown Molding, Stainless Steel Appliances that include Whirlpool gas range,...
$215,900
$215,900
Available: Right Now
Newly remodeled ranch home in Crosby. Two car carport, garage converted to a large room plus closet, and covered back patio. New roof with architectural shingles (2023), new HVAC system (2023), leveled foundation with lifetime warranty (2023), new ki...
$265,000
$265,000
Available: Right Now
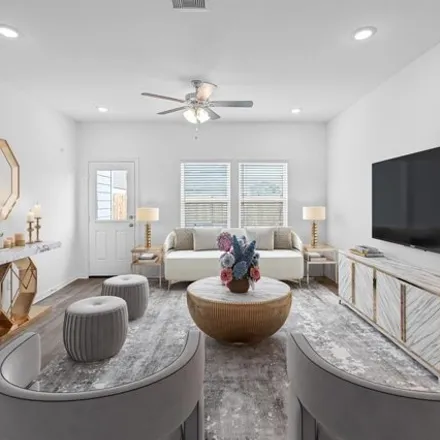
Welcome to this charming home that features 3 bedrooms, 2 bathrooms and a flexible layout with a bonus room perfect for a dining area or home office. Step inside and be greeted by charming arches that add character and sophistication throughout the h...
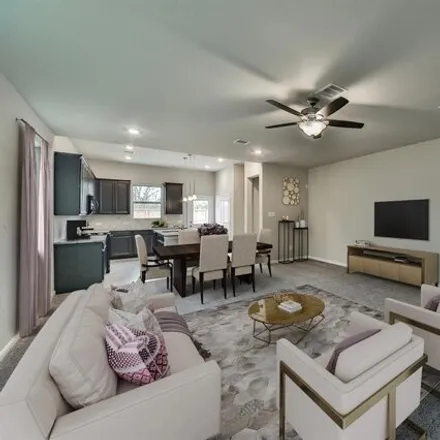
$343,527
$343,527
Available: Right Now
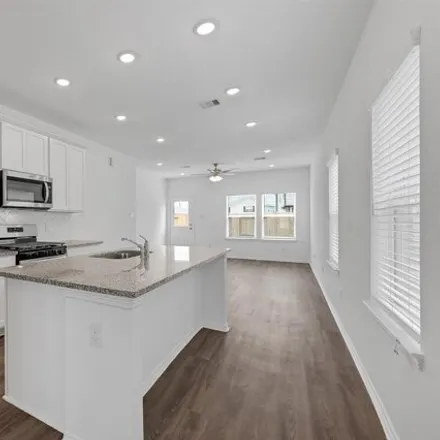
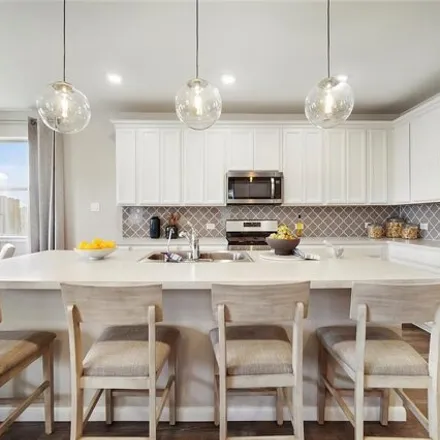
Youll be entranced by this beautiful Beazer Home in Sweetgrass Village, boasting a brick exterior, vinyl flooring, energy efficient features, an open great room, an oversized lot, and an extended covered patio. Cook up new cuisines in the kitchen, eq...
$250,000
$250,000
Available: Right Now
Welcome to this beautifully remodeled 3-bedroom, 2-bathroom sanctuary, where modern sophistication meets timeless charm. From its clean and fresh exterior to its inviting interior, this home has been meticulously and completely renovated to offer the...
$277,990
$277,990
Available: Right Now
With 2003 Square feet, the Hampton plan is a 4 bedroom/2.5 bath with the following features included : no back neighbors, Large Island, 42 Maple Kitchen Cabinets with Crown Molding, Stainless Steel Appliances that include Whirlpool gas range, ...
$364,397
$364,397
Available: Right Now
Be amazed by this stunning Beazer Home in Sweetgrass Village, boasting a brick exterior, sloped ceilings, tile flooring, energy efficient features, open great room, and an extended covered patio. Whip up tasty meals in the kitchen, equipped with lami...
$265,990
$265,990
Available: Right Now
The Bridgepor floorplan. With 1583 Square feet, the Bridgeport plan is a 4 bedroom/2 bath with the following features included : no back neighbors, Large Island, 42 Maple Kitchen Cabinets with Crown Molding , Stainless Steel Appliances that in...
$210,000
$210,000
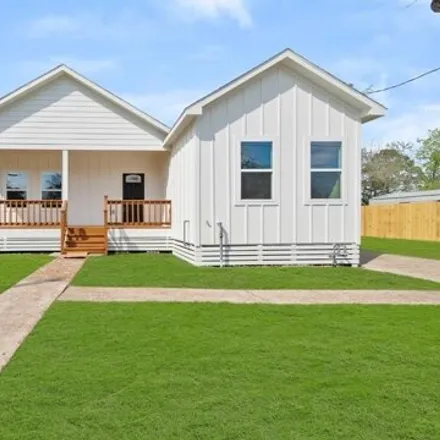
Available: Right Now
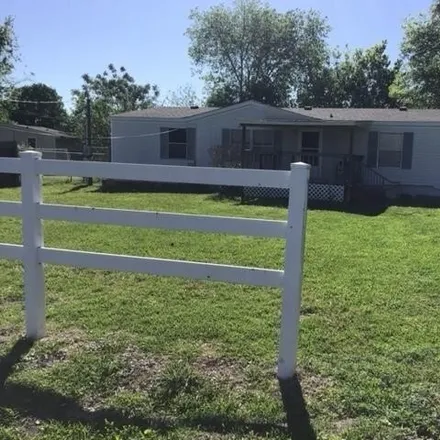
Cozy 3 bedroom 2 bath home nestled on a generous10, 000square foot property in the historic Barrett community! The oversized backyard features a fantastic addition of a 12' x 24' shed with a loft, providing ample storage space and endless possibiliti...
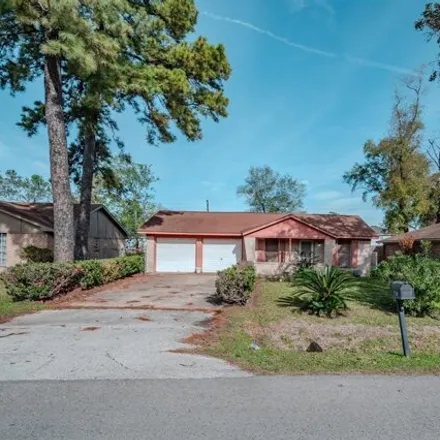
$140,000
$140,000
Available: Right Now
Selling As Is No warranties or repairs. This home features 3 bedrooms, 1 full bath and 1 half bath. Spacious fenced back yard (need some repairs) One of the few homes in the neighborhood with 2 car garage. There is a lot of potential for this propert...
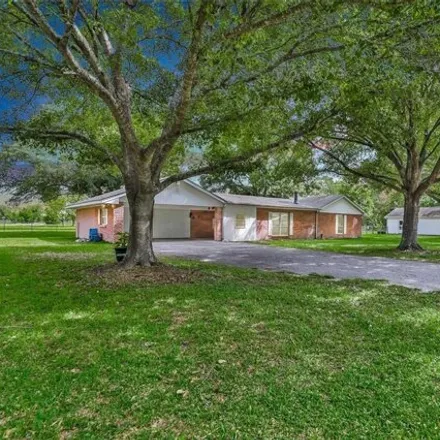
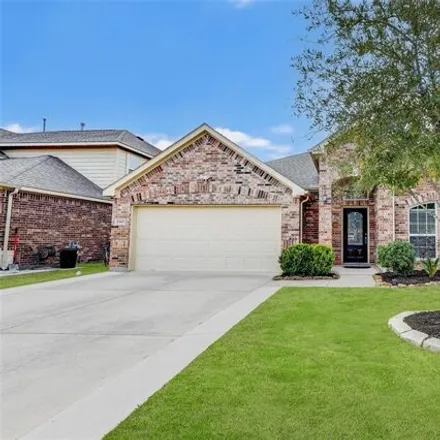
$519,900
$519,900
Available: Right Now
Prime location !! Unrestricted !! Uncover the serenity of country living in this charming 3-bedroom residence with a garage apartment/guest house, nestled in a serene setting on 4 acres with majestic oaks. Ideally located just 20 minute...
$325,000
$325,000
Available: Right Now
Welcome home ! This beautiful 3 bedroom 2-1/2 bathroom home is located in the middle of a cul-de-sac on one of the largest lots in Kodiak Crossing. Whole home Kohler generator w/10-year warranty, tankless on-demand water heater, custom window ...
$210,000
$210,000
Available: Right Now
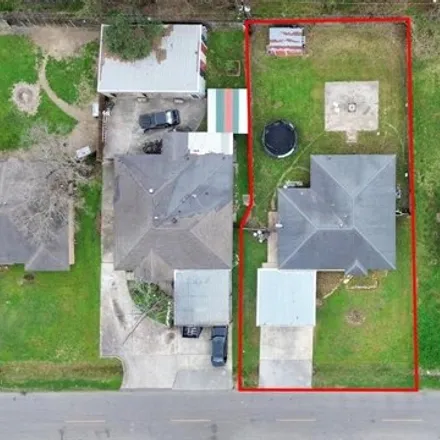
Great Investment opportunity, this is a double wide that sits on a double lot with separate utility meters. Conveniently close to Hwy 90, minutes from Beltway 8, and I-10....
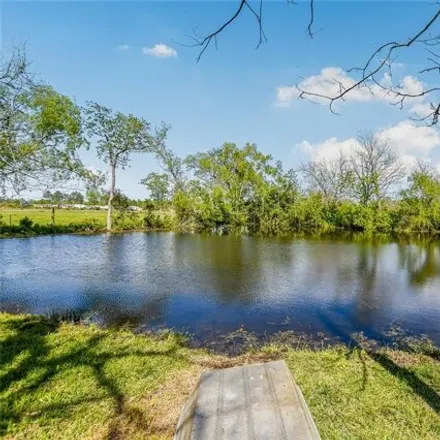
$374,900
$374,900
Available: Right Now
Re-built from the frame, up. Feels like new, 3-2 home with a large covered porch overlooking the most beautiful pond. Fish from your back yard. The porch is on the East side of the home, so you can enjoy the shaded cool evenings. 3 acres of land. No ...
$165,000
$165,000
Available: Right Now
If you are looking for a fresh start in a quiet and growing community then this is truly the home for you , Just minutes away from stores and restaurants , this is the perfect for raising children or not , location location, come see for yours...
$263,990
$263,990
Available: Right Now
The Lexington Floorplan. -With 1785 Square feet, the Lexington plan is a 4 bedroom/2.5 bath with the following features included: Large Island, 42 Maple Kitchen Cabinets with Crown Molding, Stainless Steel Appliances that include Whirlpool gas range,...
$241,490
$241,490
Available: Right Now
With 1388 Square feet, the Hartford plan is a 3 bedroom/2 bath with the following features included: Large Island, 42 Maple Kitchen Cabinets, Stainless Steel Appliances that include Whirlpool gas range, microwave oven that is vented outside and dishw...
$319,796
$319,796
Available: Right Now
This amazing Beazer Home in Sweetgrass Village is what youve been looking for, boasting a brick exterior, vinyl flooring, energy efficient features, and a covered patio. Dream up new recipes in the kitchen, fully equipped with quartz countertops, sta...
$175,900
$175,900
Available: Right Now
Welcome to your future home sweet home in Crosby, Texas! Located just 30 minutes away from Downtown Houston, this charming three-bedroom, one-and-a-half-bathroom home is bursting with potential and waiting for your personal touch. The home has had re...
$266,490
$266,490
Available: Right Now
House for sale in/on/near 184 Cottontail Drive, Harris County, TX 77532, USA. The price for this house is $266,490. This 1785-square-feet 4 bedroom house features 2 bathroom. Contact the agent to schedule an open house....
$322,094
$322,094
Available: Right Now
This home is under construction. This amazing Beazer Home on an oversized lot in Sweetgrass Village could be your dream home! This home boasts a brick exterior, tile flooring, energy efficient features, and a covered patio. Cook up new cuisines in th...

$234,490
$234,490
Available: Right Now
With 1288 Square feet, the Williamsburg plan is a 3 bedroom/2 bath with the following features included: Large Island, 42 Maple Kitchen Cabinets with Crown Molding , Stainless Steel Appliances that include Whirlpool gas range, microwave oven that is ...
$297,182
$297,182
Available: Right Now
Fall in love with this fantastic Beazer Home in Sweetgrass Village, boasting a brick exterior, vinyl plank flooring, energy efficient features, an open great room, and a covered patio. Create new recipes in the kitchen, equipped with laminate counter...
$243,490
$243,490
Available: Right Now
With 1388 Square feet, the Hartford plan is a 3 bedroom/2 bath with the following features included: Large Island, 42 Maple Kitchen Cabinets, Stainless Steel Appliances that include Whirlpool gas range, microwave oven that is vented outside and dishw...
$302,388
$302,388
Available: Right Now
Youll be entranced by this beautiful Beazer Home in Sweetgrass Village, boasting a brick exterior, vinyl flooring, energyefficient features, an open great room, and an extended covered patio. Cook up new cuisines in the kitchen, equipped with quartz ...
Barrett
According to statistics, the population in Barrett, TX amounts to 3,453, which shows decline -27% compared to the previous year. The median age of the city’s residents is 37. The average household income is $35,923, shifting growth 9% from the past year, and the average property value in Barrett, TX growth 2% to $91,100 throughout the year.
| Population | 3,453 |
| Median Age | 37.3 |
| Poverty Rate | 29% |
| Household Income | $35,923 |
| Number Of Employees | 1,133 |
| Median Property Value | $91,100 |
Household Income
The average household income in Barrett, TX grew from $32,929 to $35,923 in the past year. This data is an estimate based upon 1,194 households in Barrett, TX . The chart below presents how household income is distributed in Barrett, TX in comparison to the revenue allocation amid households nationally.
Property Value
According to data from last year, the average property value in Barrett, TX shifted from $89,100 to $91,100 throughout the year. The subsequent graph indicates the share of properties in the given price range in Barrett, TX in comparison to the median property value in the same price segment across the country. According to the data, the greatest share of Barrett, TX properties falls in the '$125,000 to $149,999' range, which is lower than the most significant median property across the country.
Rent vs. Own
Property Taxes
One of the most important aspects for property owners is the amount of property taxes. This graph shows distribution of property taxes in Barrett, TX compared to median property taxes around the country. The prevalent amount of property taxes in Barrett, TX equals $2500, which is less than the national average.