Baskin, LA, USA apartments for sale
$99,900
$99,900
Available: Right Now
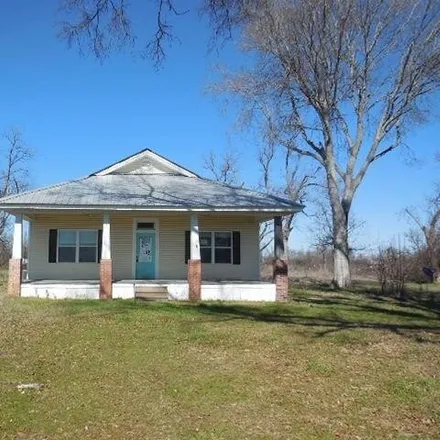
3br-2ba home on apprrox. 5 acre lot in Baskin LA. Covered front porch and back patio. First Look Period ends on5-5-2024.Owner occupant offers only during first look period....
Baskin
According to statistics, the population in Baskin, LA amounts to 264, which shows decline -19% compared to the previous year. The median age of the city’s residents is 37. The average household income is $38,000, shifting growth 20% from the past year, and the average property value in Baskin, LA growth 10% to $75,000 throughout the year.
| Population | 264 |
| Median Age | 37.3 |
| Poverty Rate | 15% |
| Household Income | $38,000 |
| Number Of Employees | 99 |
| Median Property Value | $75,000 |
Household Income
The average household income in Baskin, LA grew from $31,667 to $38,000 in the past year. This data is an estimate based upon 92 households in Baskin, LA . The chart below presents how household income is distributed in Baskin, LA in comparison to the revenue allocation amid households nationally.
Property Value
According to data from last year, the average property value in Baskin, LA shifted from $67,900 to $75,000 throughout the year. The subsequent graph indicates the share of properties in the given price range in Baskin, LA in comparison to the median property value in the same price segment across the country. According to the data, the greatest share of Baskin, LA properties falls in the '$200,000 to $249,999' range, which is lower than the most significant median property across the country.