Bridgeport, NE 69336, USA apartments for sale
$199,000
$199,000
Available: Right Now
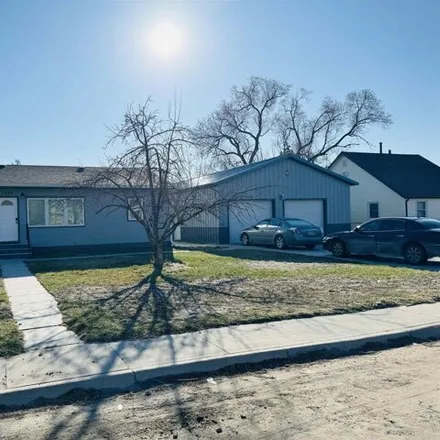
UNIQUE property and opportunity! Single level, ranch style home with1, 120square feet that includes 2 bedrooms, 1 bathroom, all electric with central air. Fresh paint and big backyard! BONUS second property, built in 2004, has1, 080square feet and co...
$120,000
$120,000
Available: Right Now
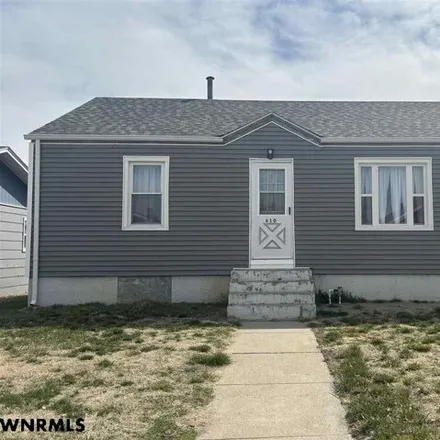
This 2 bedroom bungalow in Bridgeport features refinished wood floors, new carpet in the bedrooms, new siding on the exterior and an updated bathroom. With a full basement, there is plenty of room to add additional bedrooms and living space. A large ...
$295,000
$295,000
Available: Right Now
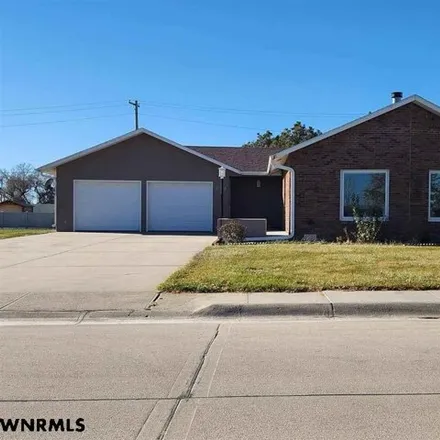
Gorgeous one level brick home with attached 2 car garage and detached 30x50 shop. The home boasts a spacious living room with a large fireplace with large flat screen tv above the mantel. The home features 2 bedrooms with a master suite with small en...
Bridgeport
According to statistics, the population in Bridgeport, NE amounts to 1,747, which shows growth 7% compared to the previous year. The median age of the city’s residents is 40. The average household income is $45,357, shifting growth 4% from the past year, and the average property value in Bridgeport, NE growth 2% to $83,900 throughout the year.
What is the Average Price of Apartments for Sale in Bridgeport, NE, 69336?
| Month | Median Price |
|---|---|
| Mar 2024 |
$329,212
|
| Feb 2024 |
$329,212
|
| Jan 2024 |
$329,212
|
| Dec 2023 |
$329,212
|
| Nov 2023 |
$310,133
|
| Oct 2023 |
$359,347
|
| Month | Median Price |
|---|---|
| Mar 2024 |
$361,824
|
| Feb 2024 |
$361,824
|
| Jan 2024 |
$361,824
|
| Dec 2023 |
$361,824
|
| Nov 2023 |
$325,603
|
| Oct 2023 |
$359,347
|
Household Income
The average household income in Bridgeport, NE grew from $43,622 to $45,357 in the past year. This data is an estimate based upon 730 households in Bridgeport, NE . The chart below presents how household income is distributed in Bridgeport, NE in comparison to the revenue allocation amid households nationally.
Property Value
According to data from last year, the average property value in Bridgeport, NE shifted from $82,100 to $83,900 throughout the year. The subsequent graph indicates the share of properties in the given price range in Bridgeport, NE in comparison to the median property value in the same price segment across the country. According to the data, the greatest share of Bridgeport, NE properties falls in the '$60,000 to $69,999' range, which is lower than the most significant median property across the country.
Property Taxes
One of the most important aspects for property owners is the amount of property taxes. This graph shows distribution of property taxes in Bridgeport, NE compared to median property taxes around the country. The prevalent amount of property taxes in Bridgeport, NE equals $1150, which is less than the national average.