Brookhaven, PA 19015, USA apartments for sale
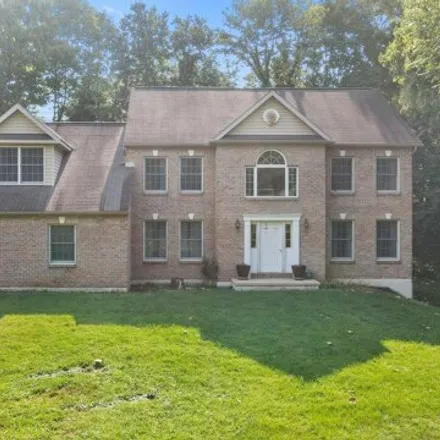
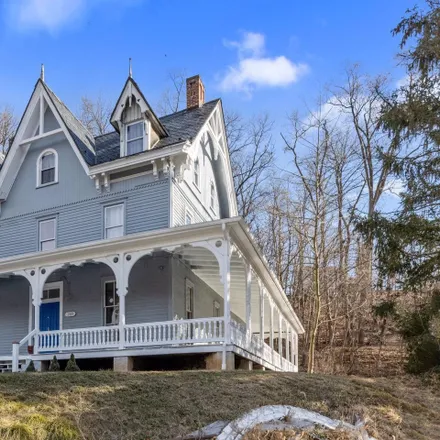
$895,000
$895,000
Available: Right Now
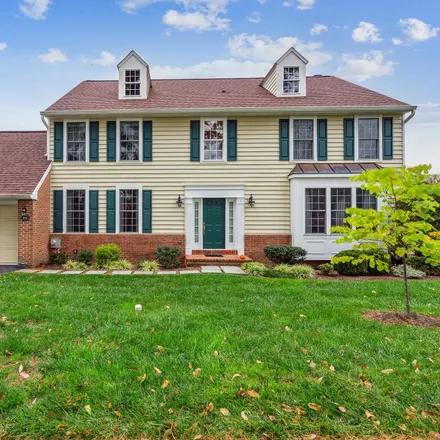
Dont miss this beautiful 5 bedroom, 2.5 bath single home situated on a rare 2.7 acre lot in the exclusive Wallingford-Swarthmore schools. Discerning buyers will appreciate the real opportunity this home and property presents in creating a private ret...
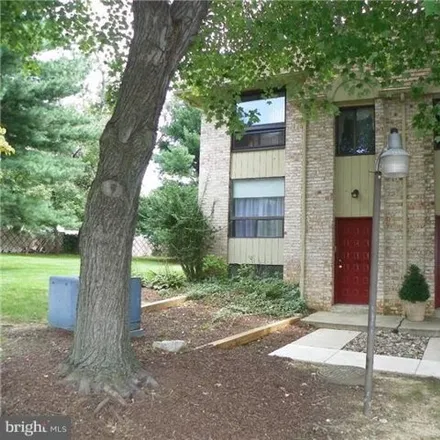
$199,900
$199,900
Available: Right Now
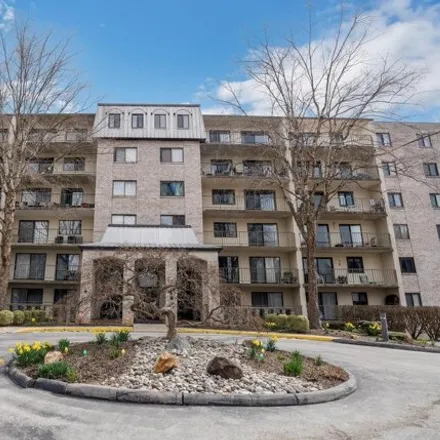
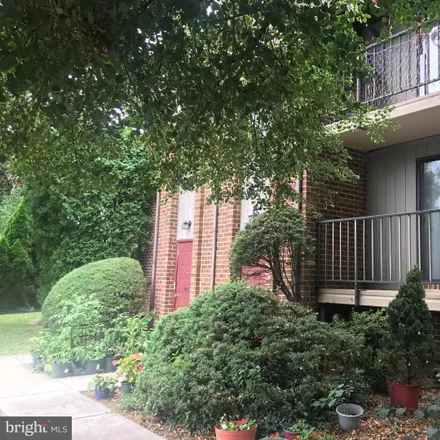
Hurry to see this modern 2 bedroom condo w/side balcony overlooking community open space! Relax and enjoy a carefree lifestyle in the popular Saybrook Village Community with a beautiful pool, lawn care, snow removal and water included. The fresh invi...
$295,000
$295,000
Available: Right Now
$235,000
$235,000
Available: Right Now
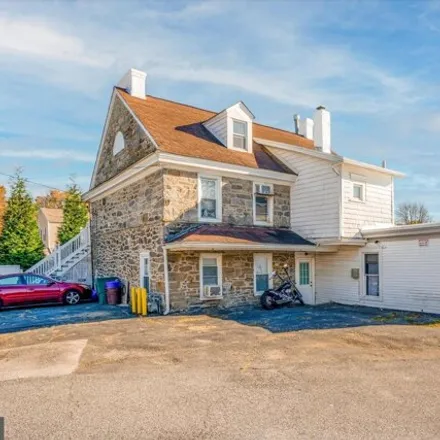
$399,500
$399,500
Available: Right Now
Investor alert ! Super Investor's Dream! Previous Historic Circa 18th Century stone single on a cul-de-sac location. Converted 3- units apartments possible 4th- with separate entrances, New replacement windows, Newer Roof, deck, French doors, ...
$499,999
$499,999
Available: Right Now

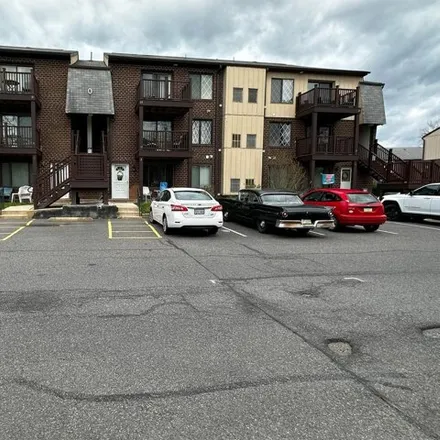
$299,900
$299,900
Available: Right Now
Seller is offering $2500 in upgrades for anyone with written offer by1/30/24! Welcome to The Residences at Brookhaven Glen, Delaware County, new construction at its finest! Many units are available on 1st, 2nd or 3rd floors in several buildings with ...
$147,900
$147,900
Available: Right Now
Move right into this perfect 1 Bedroom unit end unit. The interior of this unit has been freshly painted with new carpeting and has been well-kept by its owner through the years. Pack your bags and enjoy carefree living at its best! The Living Rm has...
$230,000
$230,000
Available: Right Now
$350,000
$350,000
Available: Right Now
Welcome to Plymouth Colony a truly exceptional living experience in this spacious three-bedroom, two-bathroom corner condo. Situated on the coveted first floor of an elevator building, this residence boasts an abundance of natural light and a layout ...
$325,000
$325,000
Available: Right Now
$275,000
$275,000
Available: Right Now
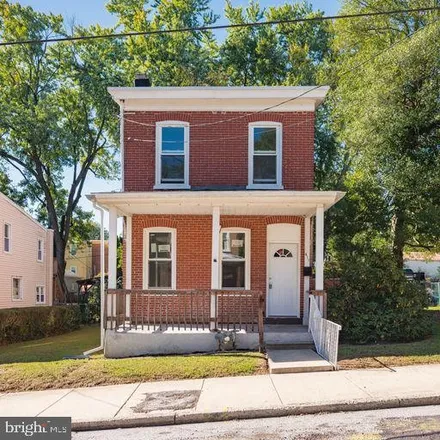
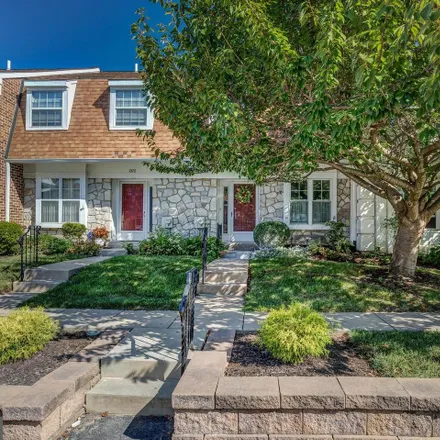
$359,900
$359,900
Available: Right Now
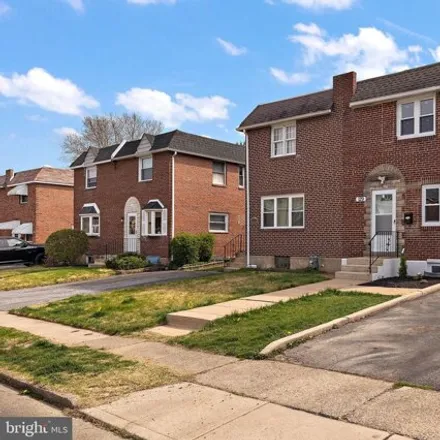
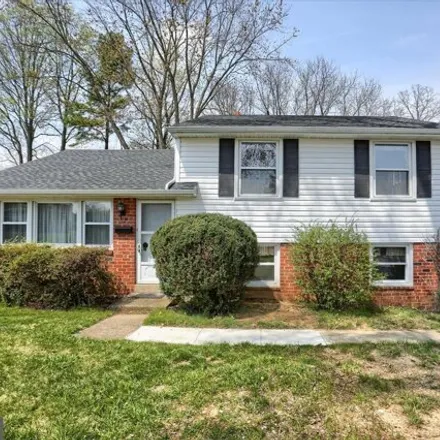
Welcome to 129 W Garrison Rd! This fully renovated solid brick 4-bedroom, 2.5 bath twin style home is located on a quiet block in Brookhaven with a paved driveway allowing for off-street parking. The 1st floor offers a large front living room, kitche...
$445,000
$445,000
Available: Right Now
$310,000
$310,000
Available: Right Now
$489,000
$489,000
Available: Right Now
$375,000
$375,000
Available: Right Now
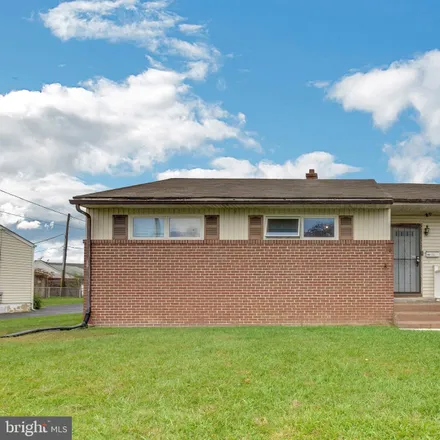
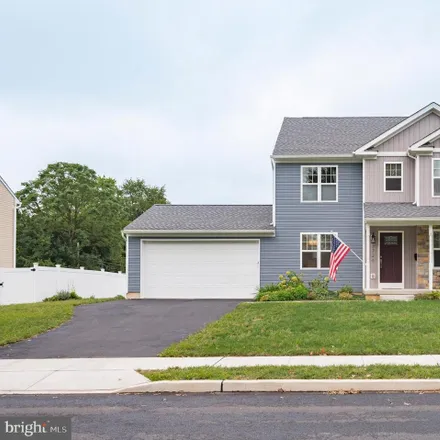
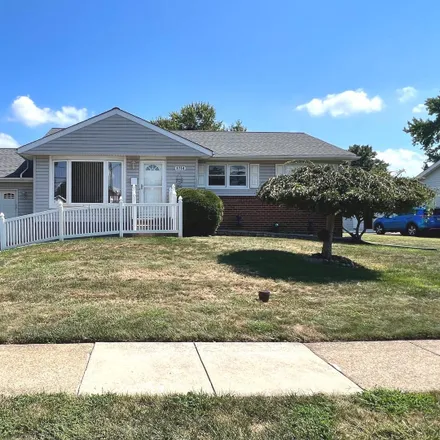
Welcome to 608 Marshall Rd, an incredible home nestled in an absolutely amazing neighborhood! Boasting over 2600sqft, a two-car driveway, and a 1 car attached garage, 608 Marshall Rd provides extraordinary space, and boundless possibilities to create...
$364,900
$364,900
Available: Right Now
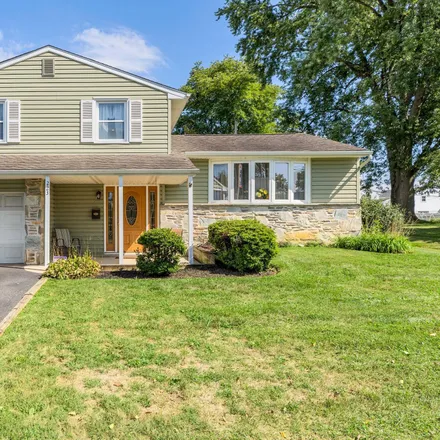
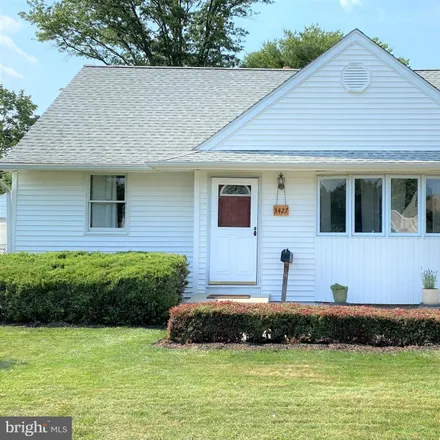
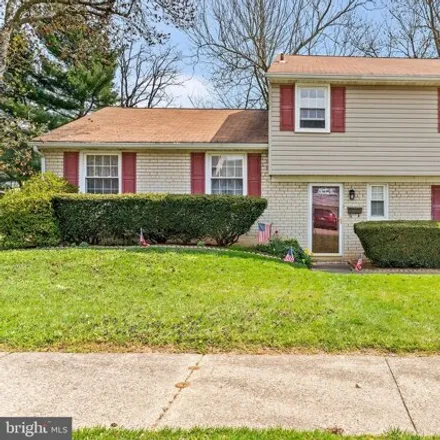
Welcome to this charming split-level home, offering a perfect blend of comfort and functionality! As you enter, you'll walk through a lower level foyer with a coat closet and up to the cozy living room where the original hardwood flooring stretches t...
$198,000
$198,000
Available: Right Now
$320,000
$320,000
Available: Right Now
$150,000
$150,000
Available: Right Now
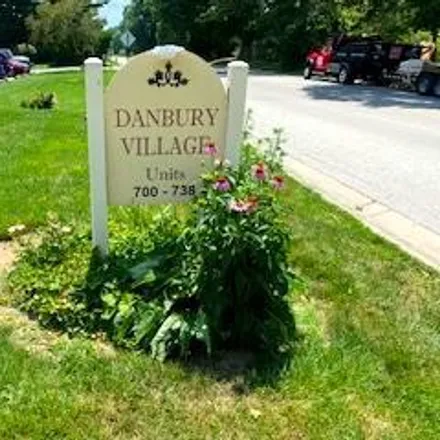
Welcome to Danbury Village second floor Condominium! This Condo offers 2 Bedrooms and 1 full bath. Nice kitchen with oak cabinets, nice size living roomhall bath with ceramic tile.Spacious main bedroom, second bedroom both with ample closet space.Low...
$358,000
$358,000
Available: Right Now
Brookhaven
According to statistics, the population in Brookhaven, PA amounts to 8,051, which shows decline 0% compared to the previous year. The median age of the city’s residents is 42. The average household income is $65,151, shifting decline -3% from the past year, and the average property value in Brookhaven, PA n/a% to $196,300 throughout the year.
What is the Average Price of Apartments for Sale in Brookhaven, PA, 19015?
| Month | Median Price |
|---|---|
| Mar 2024 |
$326,342
|
| Feb 2024 |
$326,342
|
| Jan 2024 |
$326,342
|
| Dec 2023 |
$326,342
|
| Nov 2023 |
$313,437
|
| Oct 2023 |
$376,534
|
| Month | Median Price |
|---|---|
| Mar 2024 |
$578,786
|
| Feb 2024 |
$578,786
|
| Jan 2024 |
$578,786
|
| Dec 2023 |
$578,786
|
| Nov 2023 |
$841,395
|
| Oct 2023 |
$672,190
|
Household Income
The average household income in Brookhaven, PA declined from $67,348 to $65,151 in the past year. This data is an estimate based upon 3,402 households in Brookhaven, PA . The chart below presents how household income is distributed in Brookhaven, PA in comparison to the revenue allocation amid households nationally.
Property Value
According to data from last year, the average property value in Brookhaven, PA shifted from $196,300 to $196,300 throughout the year. The subsequent graph indicates the share of properties in the given price range in Brookhaven, PA in comparison to the median property value in the same price segment across the country. According to the data, the greatest share of Brookhaven, PA properties falls in the '$200,000 to $249,999' range, which is lower than the most significant median property across the country.
Property Taxes
One of the most important aspects for property owners is the amount of property taxes. This graph shows distribution of property taxes in Brookhaven, PA compared to median property taxes around the country. The prevalent amount of property taxes in Brookhaven, PA equals $3000, which is less than the national average.