Brooten, MN, USA apartments for sale
$349,000
$349,000
Available: Right Now
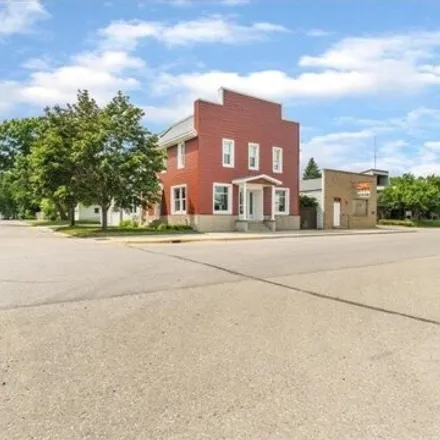
Enjoy not only the charm and character of this classic historic property, but also the modern conveniences of a renovated home. This one has it all. Much of the home, which was once a hotel, has been restored to its original beauty. Things like origi...
$149,900
$149,900
Available: Right Now
$159,900
$159,900
Available: Right Now
$195,000
$195,000
Available: Right Now
$124,999
$124,999
Available: Right Now
$142,500
$142,500
Available: Right Now
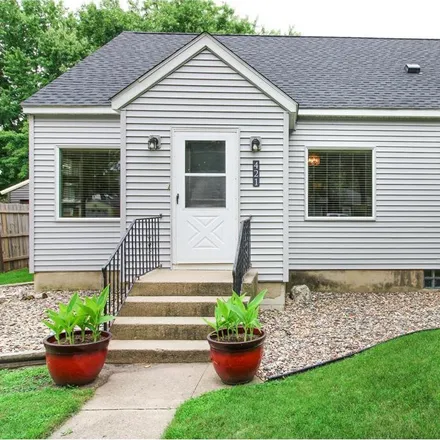
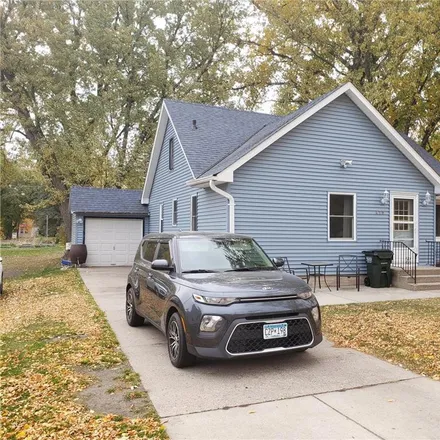
Coming soon ! 2 bed 2 bath home on a corner lot in Brooten. Home has newer shingles, siding, furnace, A/C and vinyl windows. Fenced in back yard with a detached 2 stall garage. Lower level is framed and ready to be finished. There is a potenti...
Brooten
According to statistics, the population in Brooten, MN amounts to 570, which shows decline -10% compared to the previous year. The median age of the city’s residents is 44. The average household income is $38,500, shifting decline -1% from the past year, and the average property value in Brooten, MN growth 2% to $89,900 throughout the year.
| Population | 570 |
| Median Age | 43.9 |
| Poverty Rate | 9% |
| Household Income | $38,500 |
| Number Of Employees | 251 |
| Median Property Value | $89,900 |
Household Income
The average household income in Brooten, MN declined from $38,750 to $38,500 in the past year. This data is an estimate based upon 252 households in Brooten, MN . The chart below presents how household income is distributed in Brooten, MN in comparison to the revenue allocation amid households nationally.
Property Value
According to data from last year, the average property value in Brooten, MN shifted from $87,900 to $89,900 throughout the year. The subsequent graph indicates the share of properties in the given price range in Brooten, MN in comparison to the median property value in the same price segment across the country. According to the data, the greatest share of Brooten, MN properties falls in the '$80,000 to $89,999' range, which is lower than the most significant median property across the country.
Rent vs. Own
Property Taxes
One of the most important aspects for property owners is the amount of property taxes. This graph shows distribution of property taxes in Brooten, MN compared to median property taxes around the country. The prevalent amount of property taxes in Brooten, MN equals $1150, which is less than the national average.