Bulverde, TX, USA apartments for sale
$4M
$4M
Available: Right Now
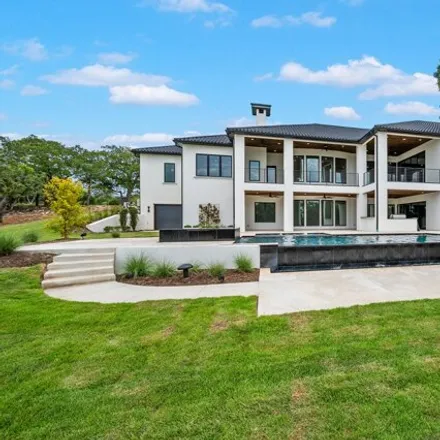
Introducing 1063 Monteola, a distinguished residence in the coveted Monteola subdivision in Bulverde, TX. This newly constructed, Wooldridge Built Home offers an unparalleled blend of size, quality, and breathtaking aesthetics across10, 525square fee...
$665,000
$665,000
Available: Right Now
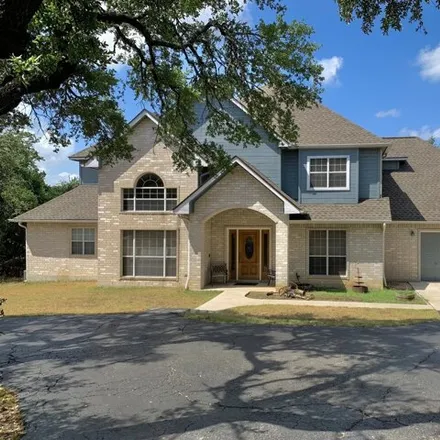
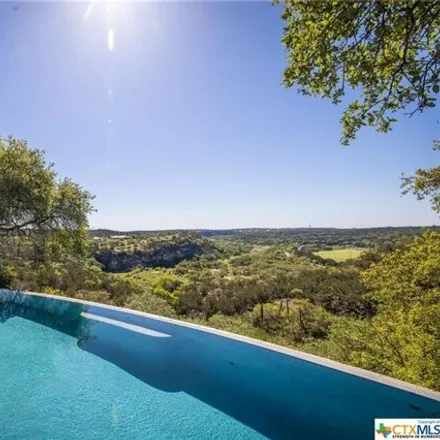
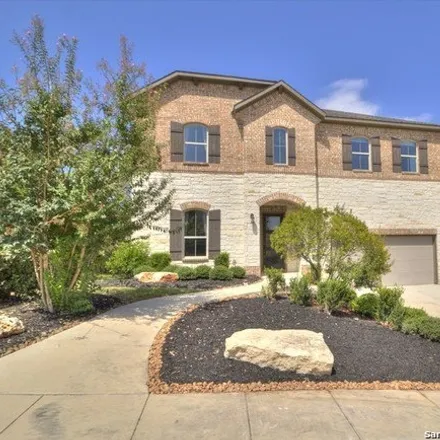
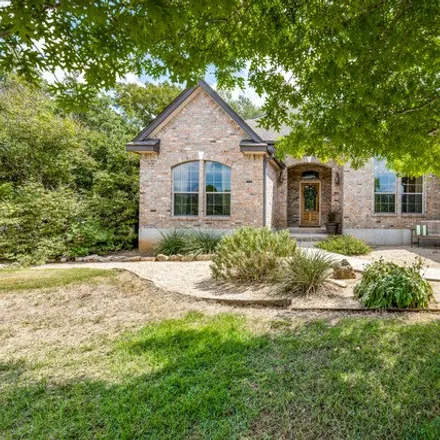
King-sized hill country home on a beautiful private estate with motivated sellers ! There are absolutely no homes immediate left, right, or back of this estate so if privacy is a want, you got it ! Tranquil path of treed acreage lead...
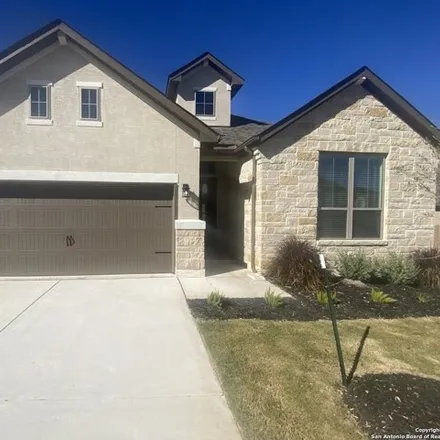
$514,900
$514,900
Available: Right Now
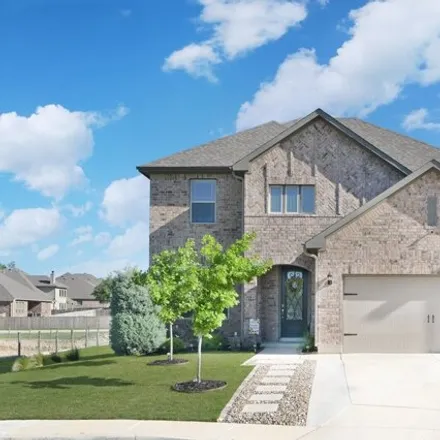
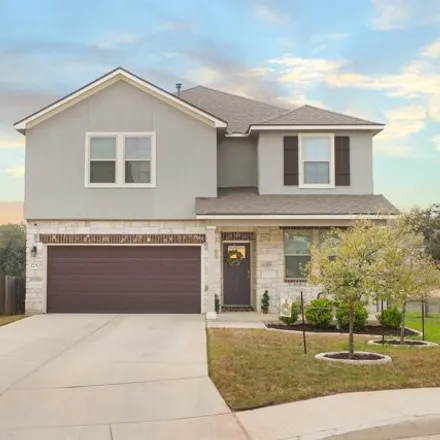
Welcome to this stunning 4-bedroom, 3.5-bathroom home nestled in the charming Singing Hills neighborhood. Boasting a picturesque two-story design, this residence offers a blend of elegance and comfort, perfect for modern living. As you step inside, y...
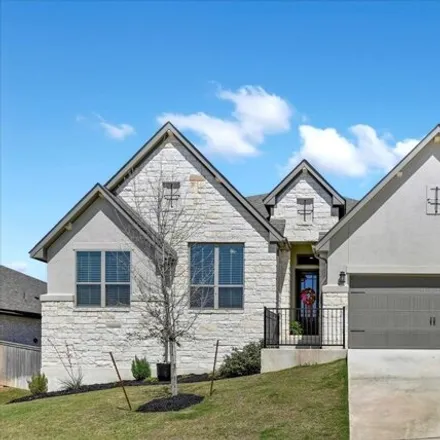
$451,789
$451,789
Available: Right Now
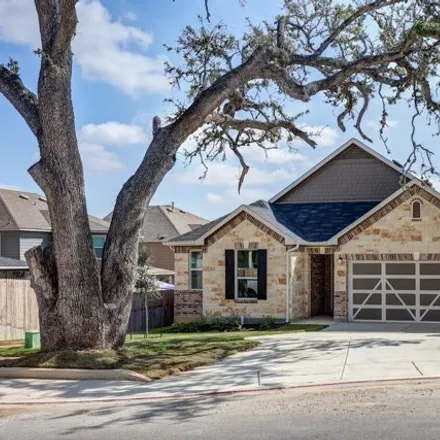
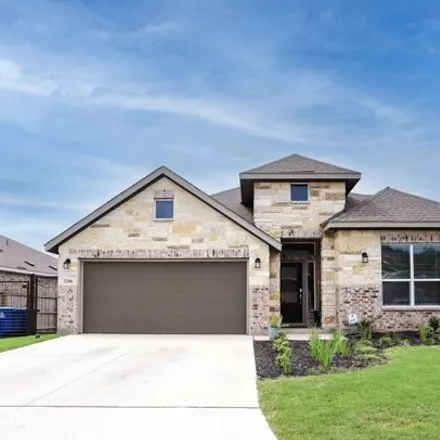
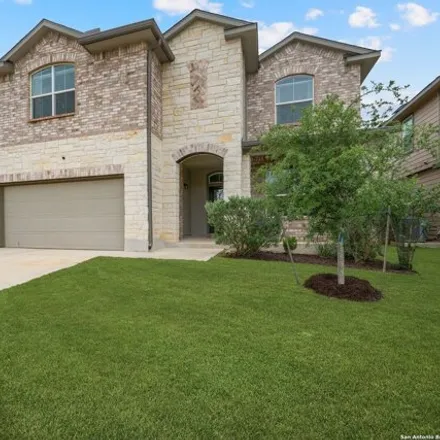
This stunning home boasts open 9-ft. ceilings and a den with double doors. The kitchen is a chef's dream with stainless steel Whirlpool appliances, including a gas cooktop and Smart single wall oven. Woodmont Dakota 42-in. upper cabinets, a Silestone...
$1,25M
$1,25M
Available: Right Now
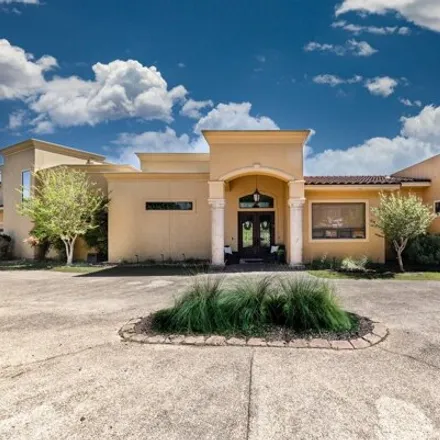
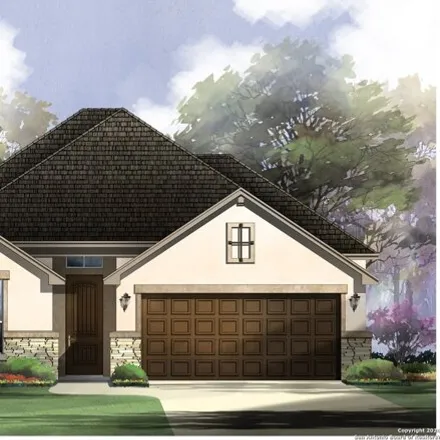
Discover your dream of luxurious Hill Country living with this expansive and elegantly appointed home, where sleek design meets Mediterranean flair. Situated on nearly 3 secluded acres, this breathtaking property offers an unrivaled oasis in the hear...
$1,75M
$1,75M
Available: Right Now
Designed for the discerning Buyer who wants what no one else has. Award Winning Austin architect, Tim Cuppett, and Builder Davee Custom Homes, produced this masterpiece which is like nothing else you have found on your home search. There are stunning...
$1,2M
$1,2M
Available: Right Now
Beautiful, Unrestricted Hill Country Property! The property features multiple residences and a commercial/ shop building with two water wells and two septic tanks permitted. Original ranch style home is a 3 bed, 2 bath at2, 444sq ft featuring a large...
$444,900
$444,900
Available: Right Now
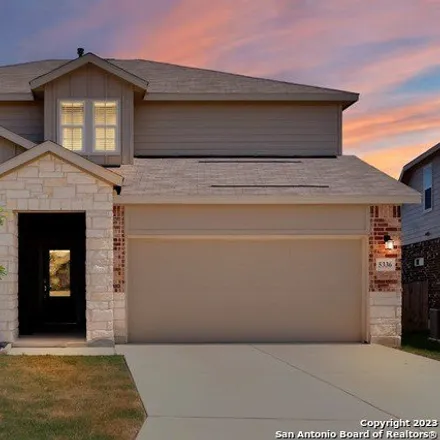
Welcome to a home that captures the essence of modern living. Opening the door, you are greeted by a beautiful open floor plan, highlighted by wood like laminate that runs throughout the first floor. Enjoy the ease of movement from the large living r...
$587,900
$587,900
Available: Right Now
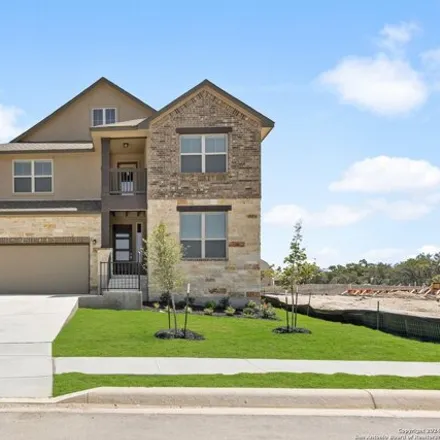
Former model home with many finish upgrades. energy efficient home in gated community by national green building award winner imagine homes. open floor plan with tile throughout ground floor, granite countertops and stainless steel appliances. neu...
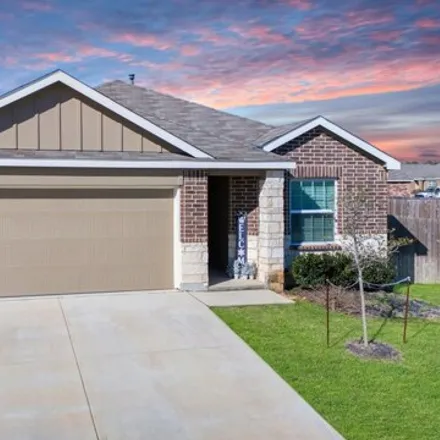
$439,900
$439,900
Available: Right Now
Welcome to your new home in the enclave of Johnson Ranch in Bulverde! This Gilson plan by Lennar built in late 2022, is on a spacious corner lot in a gated tract, and features modern upgrades. The kitchen shines with newly installed upgraded black ha...
$599,900
$599,900
Available: Right Now
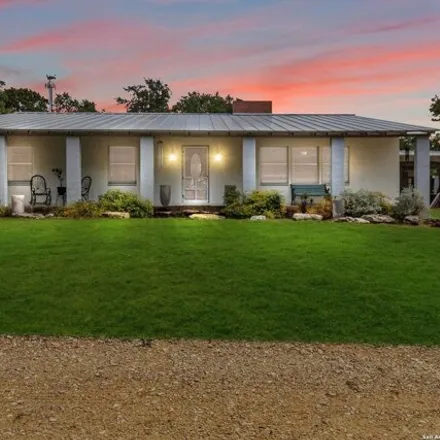
This beautiful Monticello home has it all. For you foodies, you will enjoy entertaining in this fabulous gourmet kitchen. Spacious bedrooms and 3 full baths with a great dedicated study. Enjoy the hill country breezes on your covered porch. This home...
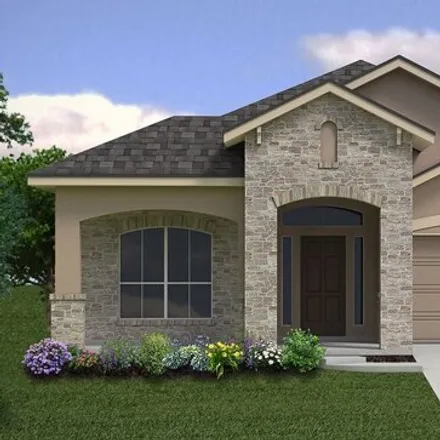
$424,990
$424,990
Available: Right Now
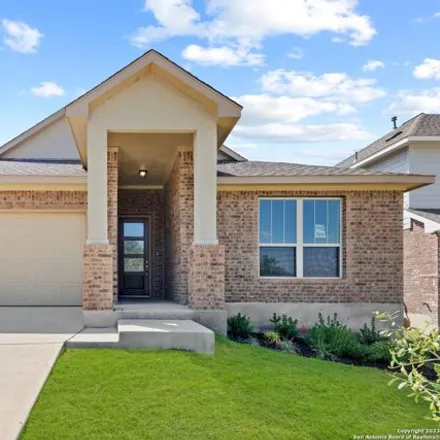
Ready Now! Love where you live in the Ventana subdivision in Bulverde, TX! The Bristol floor plan is a stunning 1-story home with 3 bedrooms, 2 bathrooms, and a 2-car garage! This home has it all, including tile throughout the common areas and a cath...
$599,900
$599,900
Available: Right Now
New Monticello Home under construction. This 2 story home has a beautiful stone and stucco elevation. Open floor plan with a 2 story ceiling at the great room and formal dining. 2 bedrooms downstairs with a study on the first floor. Grand size game r...
$759,000
$759,000
Available: Right Now
Welcome home to this great floor plan with 4 bedrooms and 3 full baths. This home features tile flooring throughout traffic areas, Natural Sunlight flows throughout home, the island kitchen offers generous counter space along with buffet cabinets in ...
$420,955
$420,955
Available: Right Now
The Driftwood is a single-story, 2050 square foot, 3 bedroom, 2 bathroom, layout. This large single-story was designed to provide any family with a spacious and comfortable living space. The inviting entry leads to a separate office area and spacious...
$417,000
$417,000
Available: Right Now
Must see virtual tour 4 bedrooms 3 full bath 2 car garage! oversized corner lot with wrap around brick and rock masonry!! inviting front porch open and functional floor plan. kitchen has gas cooking, Granite countertops with breakfast bar seat...
$430,000
$430,000
Available: Right Now
Located in the Preserve at Singing Hills community, this beautiful home offers scenic views through the oversized windows of the greenbelt out back. Backing up to the greenbelt allows for a feeling of a much larger green space. The 2456 square foot h...
$439,900
$439,900
Available: Right Now
Fall in love with this gorgeous home located in the highly sought-after Copper Canyon neighborhood. As you step inside, you'll immediately fall in love with the open and spacious floor plan. The well-designed layout offers both functionality a...
$464,900
$464,900
Available: Right Now
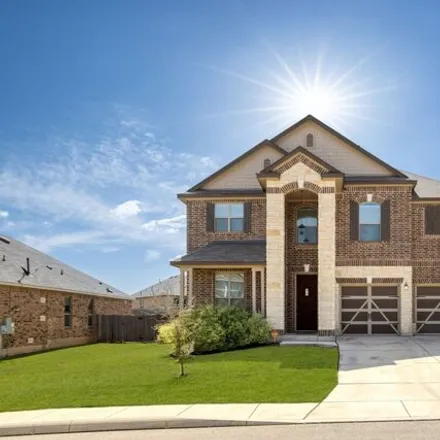
This beautifully maintained home on a corner lot in Hidden Trails shows like a model home! This two story home features an open floor plan and high ceilings throughout. With 5 bedrooms (four bedrooms upstairs, master downstairs), 3.5 baths, a study/o...
$524,990
$524,990
Available: Right Now
Ready Now! Love where you live in the Ventana subdivision in Bulverde, TX! The Atalon floor plan is a stunning 2-story home with 5 bedrooms, 3.5 bathrooms, study, formal dining, and a 2-car garage! This home has it all, including a sizable game room ...
$665,000
$665,000
Available: Right Now
$553,613
$553,613
Available: Right Now
Estimated Completion Fall 2022! Atalanti Floor Plan- ElevationC, 2256Sq. Ft. This home features 4 bedrooms, 3 baths, and a study. Beautiful gourmet kitchen package with double oven, 36 gas cooktop with vent hood, pull out trash bins, stacked upper ca...
Bulverde
According to statistics, the population in Bulverde, TX amounts to 5,042, which shows growth 4% compared to the previous year. The median age of the city’s residents is 44. The average household income is $91,579, shifting growth 3% from the past year, and the average property value in Bulverde, TX growth 5% to $284,600 throughout the year.
| Population | 5,042 |
| Median Age | 43.6 |
| Poverty Rate | 10% |
| Household Income | $91,579 |
| Number Of Employees | 2,329 |
| Median Property Value | $284,600 |
Household Income
The average household income in Bulverde, TX grew from $88,750 to $91,579 in the past year. This data is an estimate based upon 1,676 households in Bulverde, TX . The chart below presents how household income is distributed in Bulverde, TX in comparison to the revenue allocation amid households nationally.
Property Value
According to data from last year, the average property value in Bulverde, TX shifted from $271,600 to $284,600 throughout the year. The subsequent graph indicates the share of properties in the given price range in Bulverde, TX in comparison to the median property value in the same price segment across the country. According to the data, the greatest share of Bulverde, TX properties falls in the '$300,000 to $399,999' range, which is higher than the most significant median property across the country.
Rent vs. Own
Property Taxes
One of the most important aspects for property owners is the amount of property taxes. This graph shows distribution of property taxes in Bulverde, TX compared to median property taxes around the country. The prevalent amount of property taxes in Bulverde, TX equals $3000, which is less than the national average.