Canton, TX 75103, USA apartments for sale
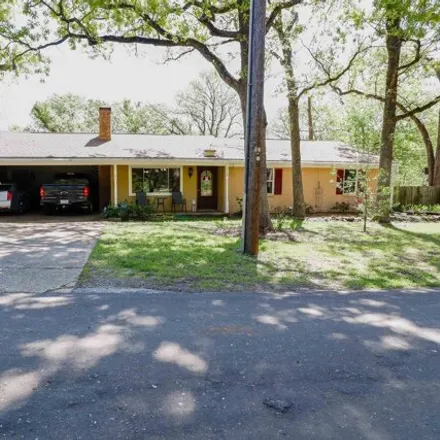
$287,000
$287,000
Available: Right Now
Welcome to your new home sweet home! This charming property has been updated by the seller, boasting a host of upgrades including granite countertops, a stunning new kitchen backsplash, fresh flooring and a sleek coat of interior and exterior paint. ...
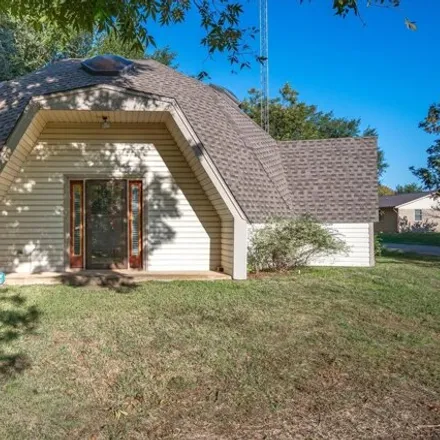
$399,999
$399,999
Available: Right Now
Welcome to this one-of-a-kind single-family home, located in the charming town of Canton, TX. This distinctive property boasts a fascinating custom-built geodesic dome design 2 story home, offering a striking architectural presence that sets it apart...
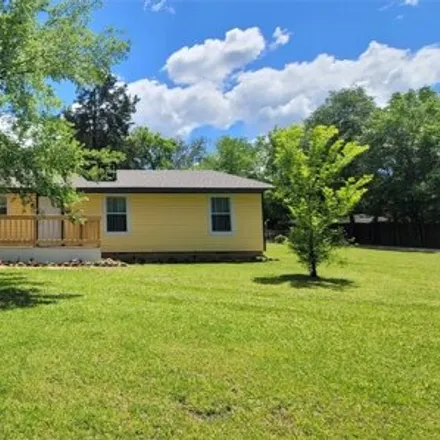
$300,000
$300,000
Available: Right Now
Country feel with city convenience. This home sits just outside the city limits with No restrictions. Had a extensive renovation in mid 2022. Roof, HVAC,flooring, fixtures, paint, and appliances were all repaired and or replaced. This home is ...
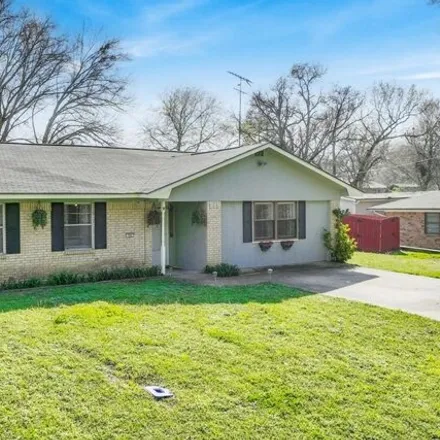
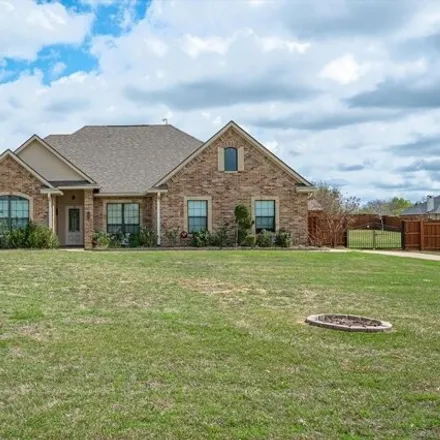
$339,000
$339,000
Available: Right Now
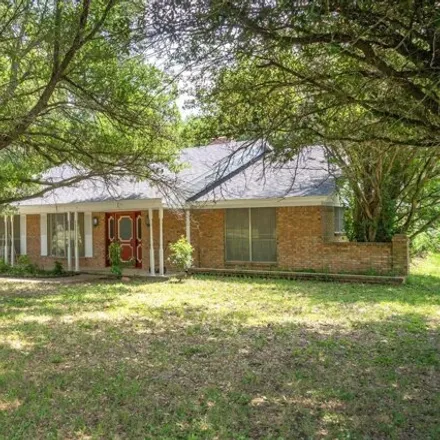
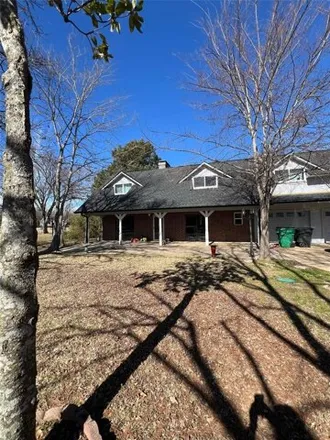
Located in the heart of Van Zandt County in the charming town of Canton, TX, this brick home has undergone plenty of updating. With close proximity to the world-famous Canton Trade Days, this home offers 3 bedrooms, 2 bathrooms, and a home office wit...
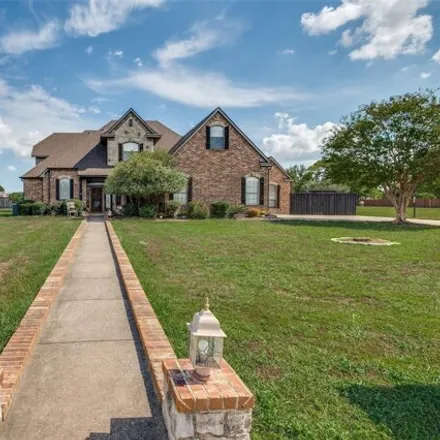
$525,000
$525,000
Available: Right Now
Located in the Prestigious Lake Meadows Estates subdivision, this spacious home has everything to offer and more. This corner lot property features 4 beds, 4 bath , 3 living rooms, office, and a true Movie Theater so there is enough room for t...
$456,500
$456,500
Available: Right Now
Well, this one of a kind property will have as much of a description as it does personality! Listen Close! The location is amazing! This is about a fourth of a mile east of the intersection ofHWYS 64and 243. Right in the middle of everything, but, hi...
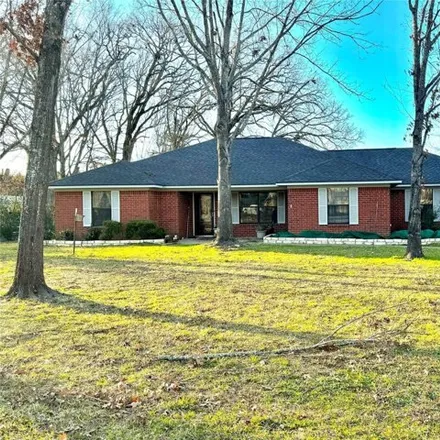
$374,900
$374,900
Available: Right Now
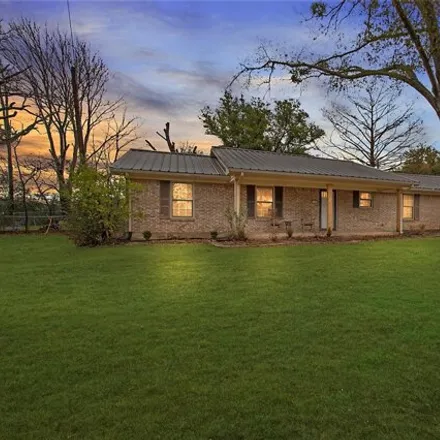
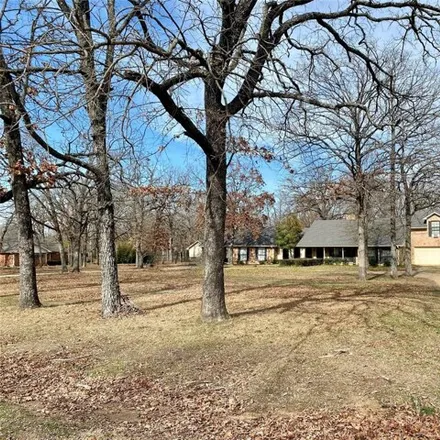
Amazing location near Canton! Nestled amidst the serene embrace of mature trees, this solid family home is a rare gem on the market. This beautiful brick home has a large yard in a quiet neighborhood. Discover tranquility in the three well-appointed ...
$224,500
$224,500
Available: Right Now
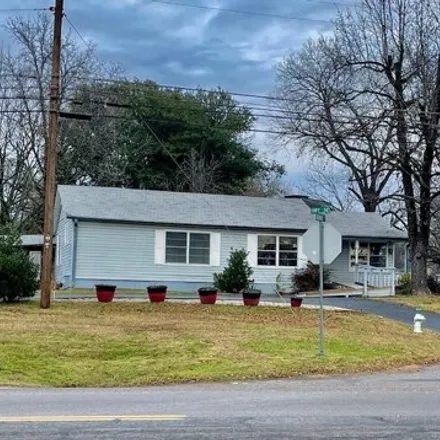
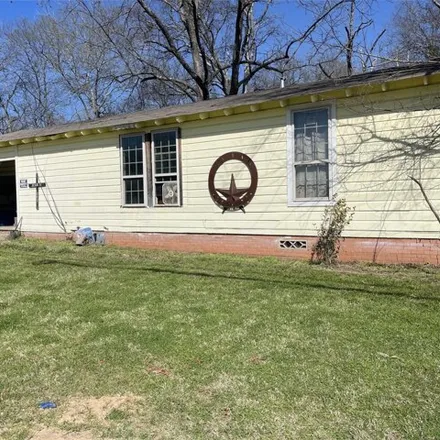
Welcome to this charming single-family home! This 3-bedroom, 2-bathroom home with metal roof features stainless steel appliances, HVAC 2021,fresh paint, plenty of kitchen cabinets as well as a built-in hutch, ceiling fans throughout, water heater 202...
$469,900
$469,900
Available: Right Now
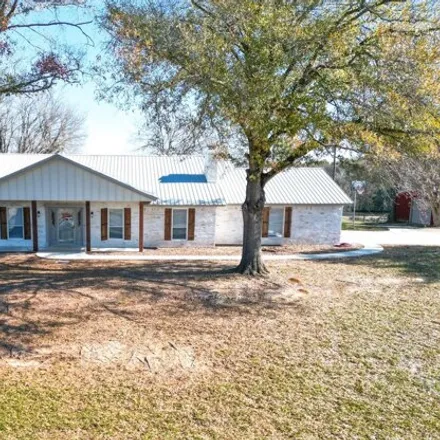
Nice home sitting on approximately 1.15 East Texas Acres in highly sought after Canton ISD. Home features 3 bedrooms, 2 baths, with open kitchen, living and dining areas. Solid surface flooring through-out. Kitchen has abundant cabinetry, granite cou...
$209,900
$209,900
Available: Right Now
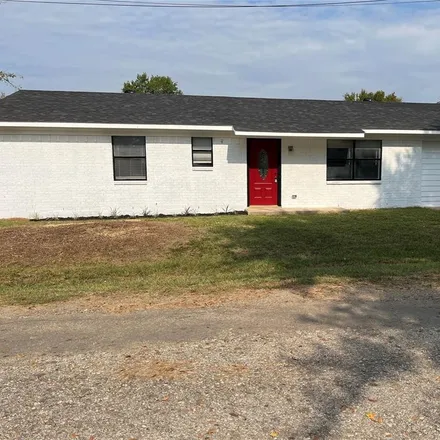
$147,000
$147,000
Available: Right Now
Unique opportunity:Residential tenant-occupied commercial property located in close proximity to world-famous Canton First Monday. SoldAS IS.Great residential area near schools. Tenant would stay or move. NOTE:General Commercial zoning. Excellent loc...
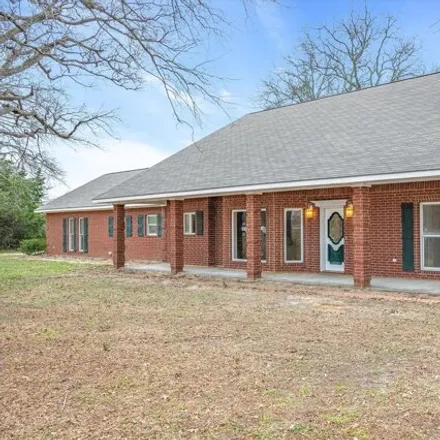
$540,000
$540,000
Available: Right Now
Astonishingly Beautiful Custom Designed Home! Formal Entrance Opens to an Impressive Floor to Ceiling Brick Fireplace, Vaulted Gleaming Wood Panel Ceilings and Architectural Interest Wood Ceiling Beam. Custom Millwork and Moulding Throughout adds Cus...
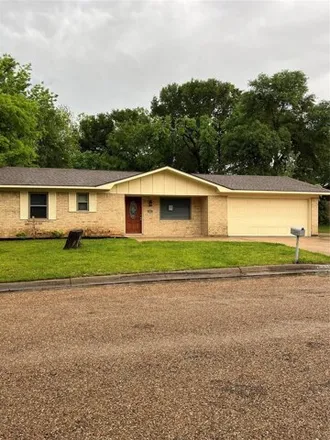
$289,000
$289,000
Available: Right Now
Enchanting three-bedroom, two-bathroom home with attached two-car garage, situated on oversized corner lot. Recent upgrades include a new roof, remodeled bathrooms, and new flooring. The spacious living room seamlessly connects to a sun-drenched room...
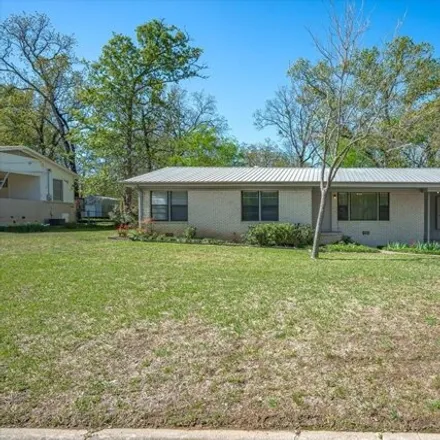
$234,900
$234,900
Available: Right Now
Discover this 3-bedroom, 2-bathroom abode nestled in the highly sought-after CantonISD. Astone's throw from Veteran's Memorial Plaza and First Monday Marketplace, this home combines community convenience with serene privacy. Inside, luxury vinyl plan...
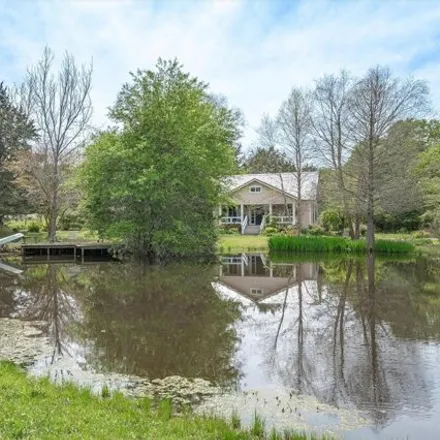
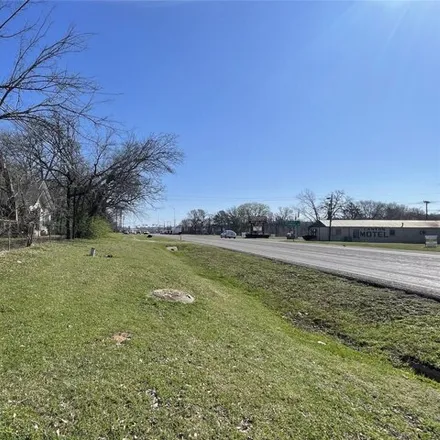
$699,000
$699,000
Available: Right Now
812 Ft of Road Frontage on Hwy 19 would be great for any business AND it's located just 1 Mile North of I-20. Incredible small farm on 10 AgEXEMPTAcres! This completely updated home offers 4 Bedrooms and 3 full bathrooms. TWO Master suits and a separ...
$374,000
$374,000
Available: Right Now
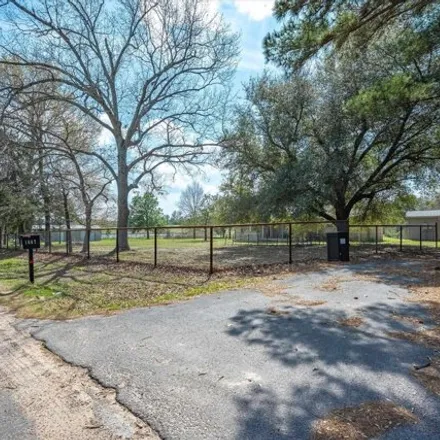
Sweet, Cozy Farmhouse sitting on7.99 MOLEast Texas Acres in highly sought-after Canton ISD! 2 Bedroom, 1 Bath clean and completely updated. Solid surface floors throughout and decorative lighting. Acreage has a lot to offer. Back is heavily wooded wi...
$388,000
$388,000
Available: Right Now
Own acreage in the city limits, close to First Monday and I-20. Four bedrooms, Four full restrooms on Four acres. Look across the road to the country club golf course. You will get a long driveway with a 2 car garage, two dining areas, two living are...
$575,000
$575,000
Available: Right Now
This is a rare find with 1.61 acres close to town and outside the city limits. On a quiet street this is a great place to live and have rental income. The main residence has a split floor plan with 2 primary bedrooms and 2 baths, 3 living areas, larg...
$239,000
$239,000
Available: Right Now
Discover the charm of this recently refreshed 3-bedroom, 2-bath home nestled in the heart of Canton. Embrace convenience with schools, stores, and churches just moments away. Unwind in the spacious backyard boasting a large shop, raised garden beds, ...
$400,000
$400,000
Available: Right Now
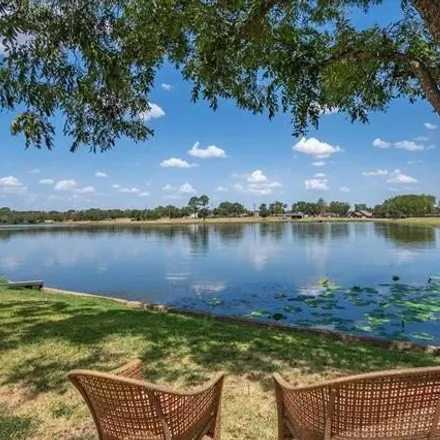
Rare opportunity to own 1 of only 9 Lakefront properties inside the City of Canton. This home is immaculate and has been completely renovated inside and out with quality finishes. Home was taken back to the studs and finished out with Luxury Vinyl Pl...
$552,400
$552,400
Available: Right Now
This house has so many opportunities, big family, in laws, or an investment considering the attached apartment and room sizes. It was previously used as a bed and breakfast; The owner must sell due to personal circumstances. The house contains a tota...
$165,000
$165,000
Available: Right Now
Unique opportunity:Residential tenant-occupied commercial property located in close proximity to world-famous Canton First Monday. SoldAS IS.Great residential area near schools. Long-term tenant would stay or move. NOTE:General Commercial zoning. Exc...
Canton
According to statistics, the population in Canton, TX amounts to 3,716, which shows growth 1% compared to the previous year. The median age of the city’s residents is 47. The average household income is $44,344, shifting growth 8% from the past year, and the average property value in Canton, TX decline -5% to $90,500 throughout the year.
What is the Average Price of Apartments for Sale in Canton, TX, 75103?
| Month | Median Price |
|---|---|
| Mar 2024 |
$262,073
|
| Feb 2024 |
$262,073
|
| Jan 2024 |
$262,073
|
| Dec 2023 |
$262,073
|
| Nov 2023 |
$243,067
|
| Oct 2023 |
$224,775
|
| Month | Median Price |
|---|---|
| Mar 2024 |
$267,633
|
| Feb 2024 |
$267,633
|
| Jan 2024 |
$267,633
|
| Dec 2023 |
$340,125
|
| Nov 2023 |
$289,293
|
| Oct 2023 |
$298,469
|
Household Income
The average household income in Canton, TX grew from $41,250 to $44,344 in the past year. This data is an estimate based upon 1,477 households in Canton, TX . The chart below presents how household income is distributed in Canton, TX in comparison to the revenue allocation amid households nationally.
Property Value
According to data from last year, the average property value in Canton, TX shifted from $94,800 to $90,500 throughout the year. The subsequent graph indicates the share of properties in the given price range in Canton, TX in comparison to the median property value in the same price segment across the country. According to the data, the greatest share of Canton, TX properties falls in the '$70,000 to $79,999' range, which is lower than the most significant median property across the country.
Property Taxes
One of the most important aspects for property owners is the amount of property taxes. This graph shows distribution of property taxes in Canton, TX compared to median property taxes around the country. The prevalent amount of property taxes in Canton, TX equals $1750, which is less than the national average.