Cerritos, CA, USA apartments for sale
$107,000
$107,000
Available: Right Now
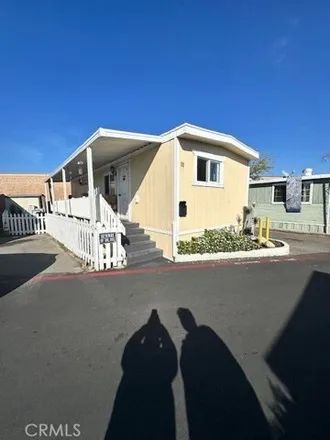
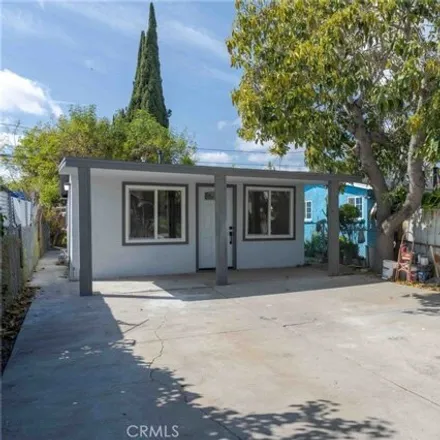
Welcome to this starter Mobile Home, features 1 good size bedrooms and 1-bath...PERFECTfor your family...Sellers have made improvements like laminated flooring in the house and new windows Discover a charming mobile home in the heart of Norwalk, Cali...
$934,990
$934,990
Available: Right Now
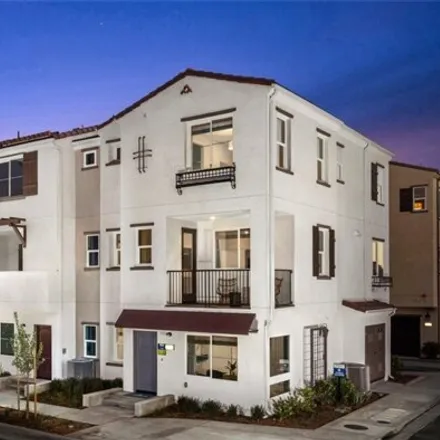
Introducing our stunning corner model home, flooded with natural light and boasting$74, 000in upgrades. From upgraded flooring to a gourmet kitchen featuring White Shaker style Cabinets, Simply White Quartz Countertops, and stainless steel Samsung ap...
$79,900
$79,900
Available: Right Now
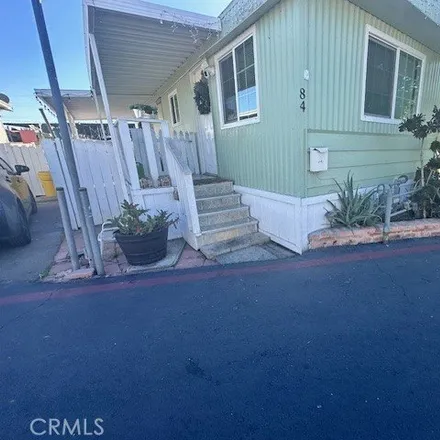
Welcome to this starter Mobile Home, features 1 good size bedrooms and 1-bath...PERFECTfor your family...Sellers have made improvements like laminated flooring in the house and new windows Upgraded Kitchen, Bathroom. Park approval is required for all...
$747,500
$747,500
Available: Right Now
$1,9M
$1,9M
Available: Right Now
First time on the market since 1970!!!! Rarely available and well-maintained fourplex with a desirable mix of units located on a wide and low-density cul de sac. Each unit comes with a private garage and additional parking space along with ample stre...
$527,000
$527,000
Available: Right Now
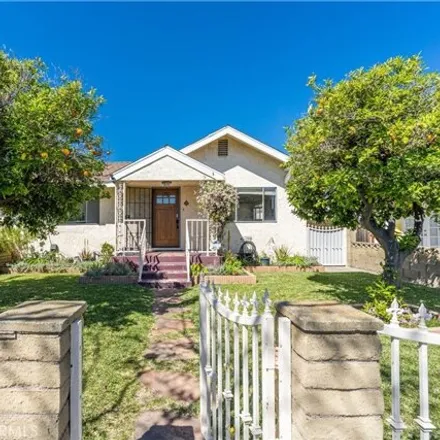
Nicely remodeled 2 bedroom and 1 bathroom cozy home for those first time homebuyers who are eager to purchase a home to call their own. This property features a brand new roof, brand new water heater, floorings throughout the home, nice granite count...
$975,000
$975,000
Available: Right Now
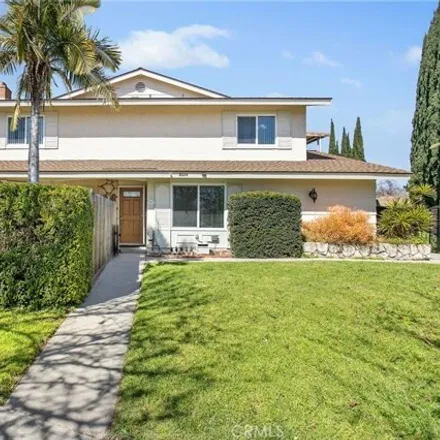
Welcome to this charming home, ideally located in the coveted ABC School District. This property boasts a comfortable1, 480square feet of living space, complete with three well-sized bedrooms and two full bathrooms. As soon as you enter, you'll be gr...
$688,000
$688,000
Available: Right Now
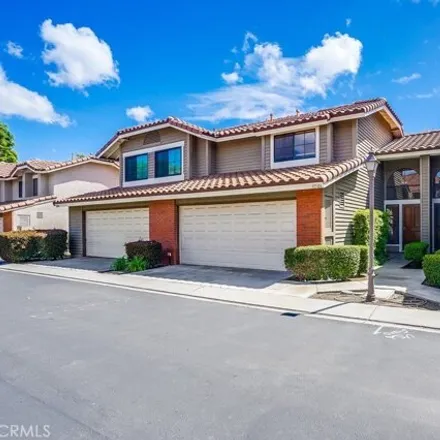
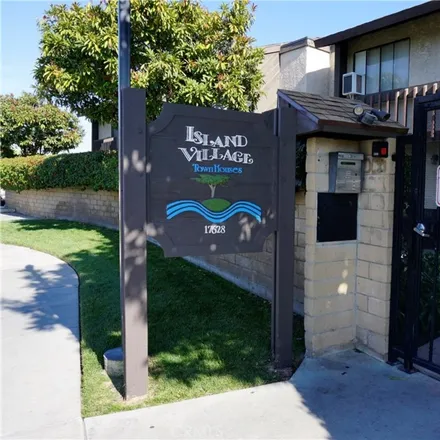
This 2-story townhome in Cerritos is nestled within a serene, gated community and in a Planned Unit Development (PUD) within the ABC School District. Upon entry, you're greeted by a welcoming living room adorned with wood flooring, a cozy fireplace, ...
$1,05M
$1,05M
Available: Right Now
When Second Best isnt good enough! No stone has been left unturned on this newly remodeled home situated in this family and kid-friendly tree lined neighborhood of Cerritos. Convenient to Shopping, freeways, auto mall, restaurants, parks, hospitals a...
$875,000
$875,000
Available: Right Now
$899,999
$899,999
Available: Right Now
$1,2M
$1,2M
Available: Right Now
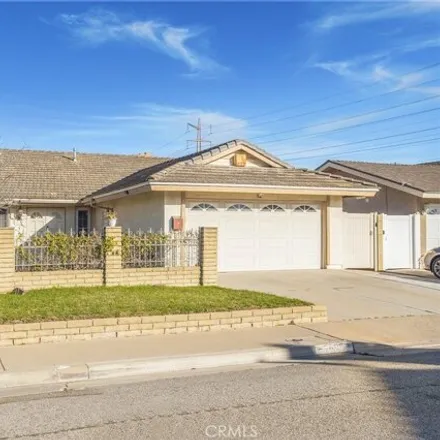
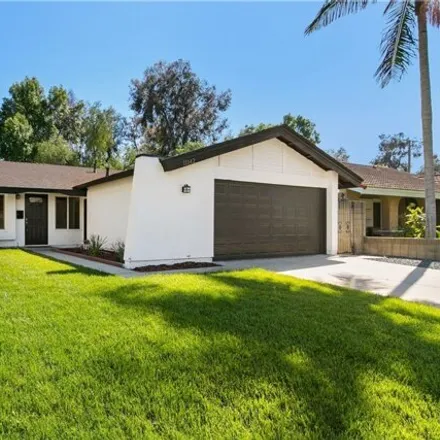
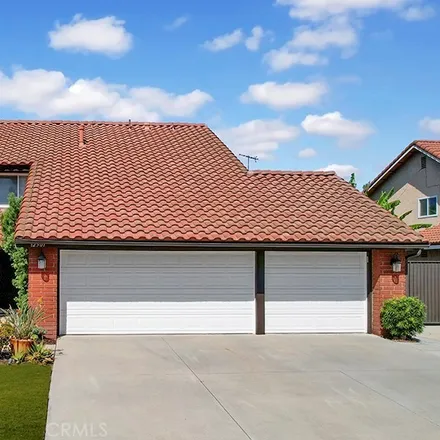
Phenomenal One-Story Corner lot house welcomes you! This truly impeccable home is located in ABC School District in Cerritos 3 Bedrooms and 2 Bathrooms House has upgraded with Recessed lightings throughout, Ceiling Fans in Family room and Master Bedr...
$437,000
$437,000
Available: Right Now
$988,800
$988,800
Available: Right Now
Stunning 3 bedroom 2 bath home with its cul-de-sac location offers privacy and a sense of community. Meticulously remodeled interior provides modern comfort and style. Two spacious living areas and large dining room are perfect for entertainin...
$1,1M
$1,1M
Available: Right Now
One not to miss ! Best of locations 2nd home from end of culdesac. Lots of upgraded items such as roof, artificial turf-front and rear. Very low maintenance front and back yards. Gorgeous brick work leads to beautiful double door entry with le...
$869,000
$869,000
Available: Right Now
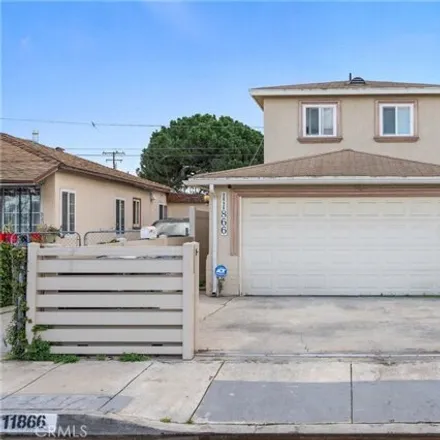
Welcome to 5409 Hackett Ave! This charming and roomy home sits on a5, 000square foot lot, offering four bedrooms and two bathrooms along with a flowing layout. Mature landscaping and fruit trees adorn the backyard, providing a serene retreat. Additio...
$585,000
$585,000
Available: Right Now
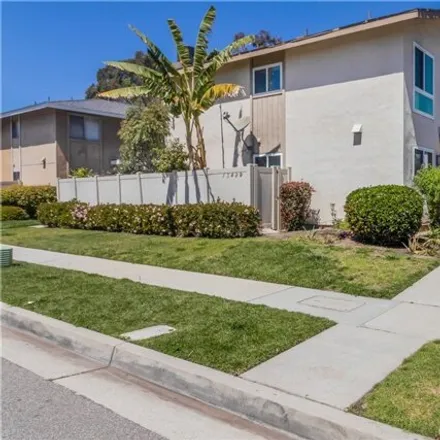
Welcome to this delightful two-bedroom, 1.5-bathroom condo nestled on a corner unit in Cerritos. Step into the bright living room adorned with recessed lights and built-in storage, complemented by laminate flooring throughout. The kitchen features gr...
$699,999
$699,999
Available: Right Now
Charming Two-Story Residence in Prestigious ABC School District Discover the perfect blend of comfort and convenience in this delightful 3-bedroom, 1.5-bath home, nestled in the highly sought-after ABC school district. This residence shines with new ...
$1,6M
$1,6M
Available: Right Now
This is an opportunity to own a rare, charming oasis in the heart of Artesia, CA. This remarkable property boasts 7 bedrooms, 4 bathrooms, and over2, 800square feet of luxurious living space. Situated on an expansive lot spanning nearly8, 000square f...
$1,36M
$1,36M
Available: Right Now
$1,2M
$1,2M
Available: Right Now
Welcome to a gorgeous 5 Bedrooms 3 Bathroom home nestled on a quiet street on Toulouse, has an amazing floor plan in the beautiful city of La Palma. Remodeled kitchen around 2015, with granite counter top, recessed lighting, walk in pantry and storag...
$980,000
$980,000
Available: Right Now
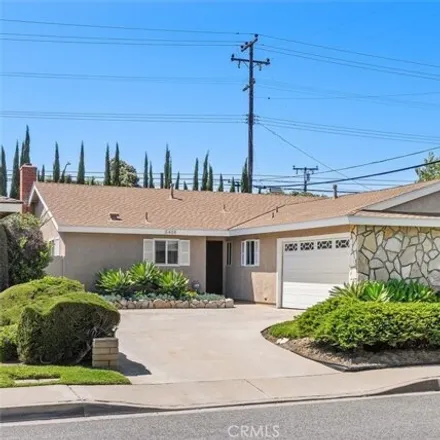
One of top school district area. A rare find which is full of potential! Phenomenal One-Story Cul-de-Sac house welcomes you!, 3 bedrooms, 2 baths with a cozy family room, newer roof(6 Month), central air, central heating, lovely back yard with vegeta...
Cerritos
According to statistics, the population in Cerritos, CA amounts to 50,145, which shows decline 1% compared to the previous year. The median age of the city’s residents is 46. The average household income is $98,953, shifting growth 4% from the past year, and the average property value in Cerritos, CA growth 3% to $638,600 throughout the year.
| Population | 50,145 |
| Median Age | 45.5 |
| Poverty Rate | 5% |
| Household Income | $98,953 |
| Number Of Employees | 22,710 |
| Median Property Value | $638,600 |
Household Income
The average household income in Cerritos, CA grew from $95,373 to $98,953 in the past year. This data is an estimate based upon 15,541 households in Cerritos, CA . The chart below presents how household income is distributed in Cerritos, CA in comparison to the revenue allocation amid households nationally.
Property Value
According to data from last year, the average property value in Cerritos, CA shifted from $620,500 to $638,600 throughout the year. The subsequent graph indicates the share of properties in the given price range in Cerritos, CA in comparison to the median property value in the same price segment across the country. According to the data, the greatest share of Cerritos, CA properties falls in the '$500,000 to $749,999' range, which is higher than the most significant median property across the country.
Rent vs. Own
Property Taxes
One of the most important aspects for property owners is the amount of property taxes. This graph shows distribution of property taxes in Cerritos, CA compared to median property taxes around the country. The prevalent amount of property taxes in Cerritos, CA equals $3000, which is less than the national average.