Chappaqua, NY, USA apartments for sale
$1,95M
$1,95M
Available: Right Now
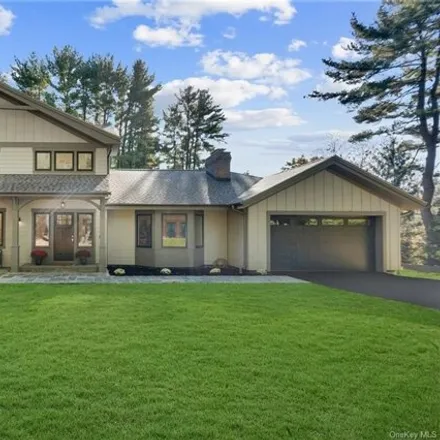
Brand new construction!!! Move right in to this custom built modern farm house with a luxurious extra large first floor primary suite minutes to Chappaqua's downtown and train. Beautiful flat yard. This well thought out home was built by a local expe...
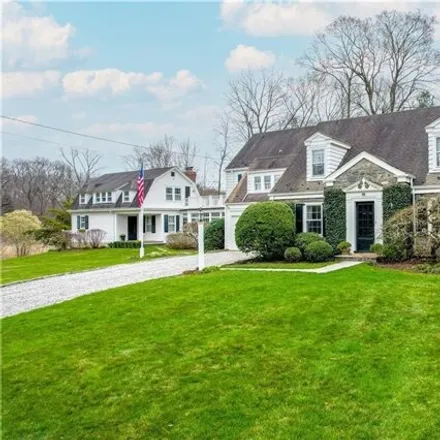
$848,000
$848,000
Available: Right Now
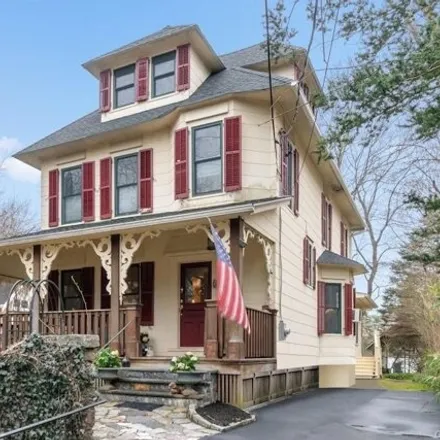
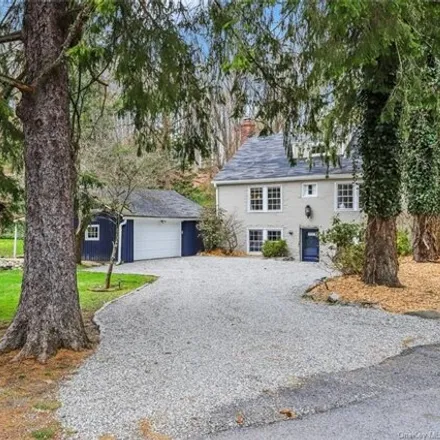
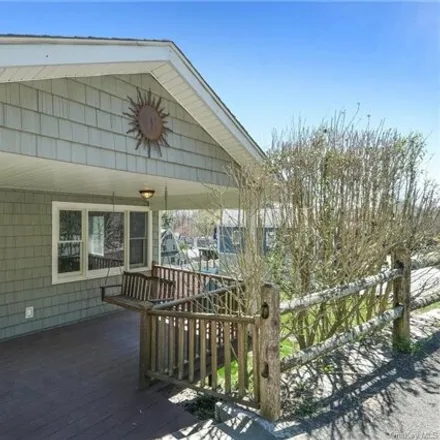
This Traditional Colonial home is on level property in a residential neighborhood, walkable to shops and train in the Village of Chappaqua, and features impressive curb appeal with a welcoming wrap-around covered front porch. Natural light fills the ...
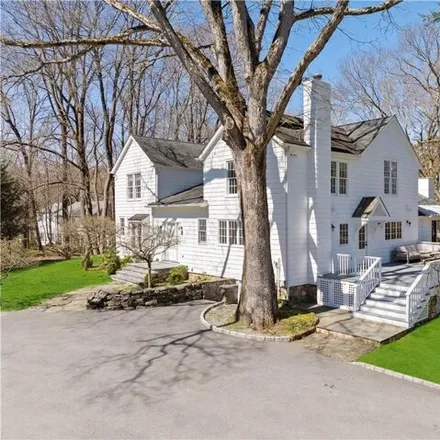
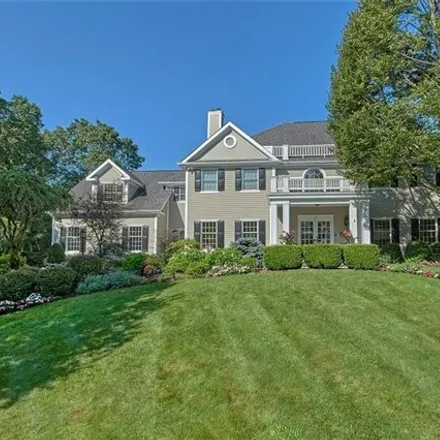
$1,8M
$1,8M
Available: Right Now
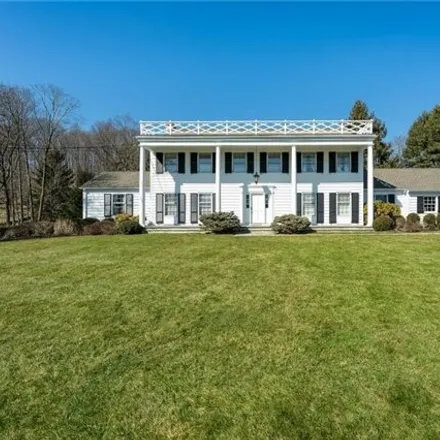
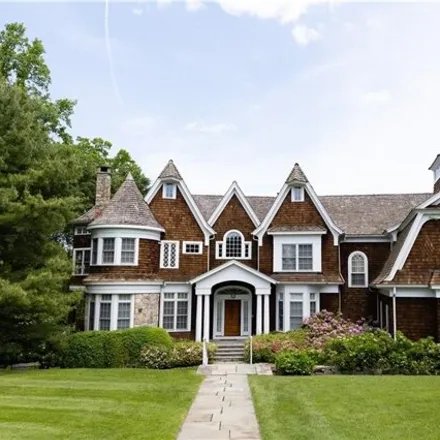
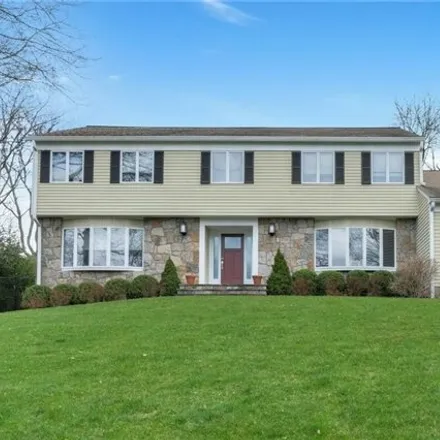
Elegant Bradley built center hall colonial (with plaster walls) situated on a premier street in one of the most sought after neighborhoods. Schools, train station, restaurants, shops and grocery stores are minutes away. The property is stunning, havi...
$1,95M
$1,95M
Available: Right Now
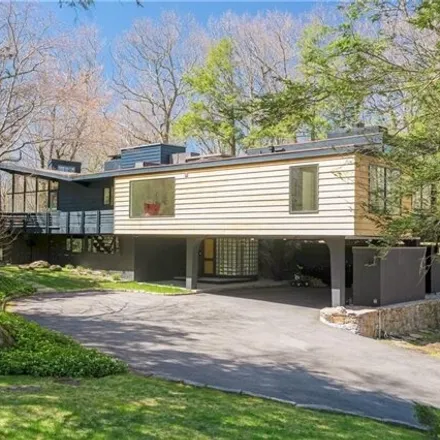
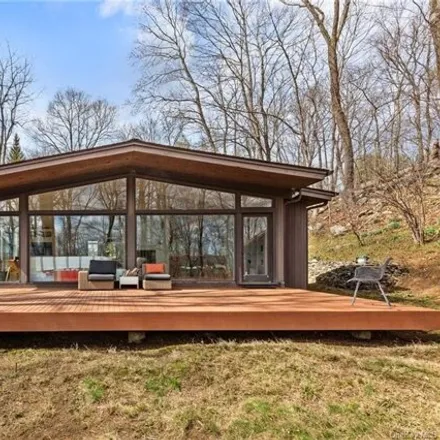
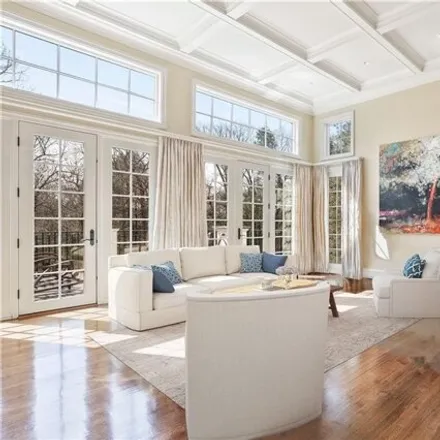
Noted architect david henken designed this home in 1957 embracing the union of landscape and Architecture. Nested atop a private zen-like oasis you immediately understand Henken's genius of using the natural topography while conc...
$3,35M
$3,35M
Available: Right Now
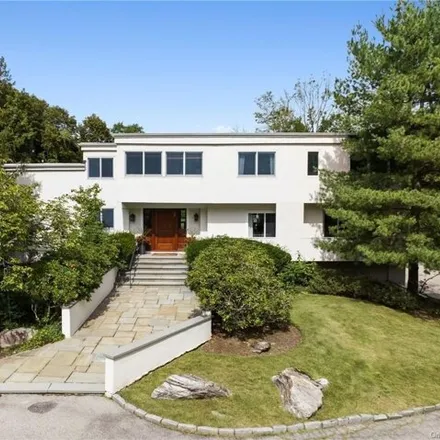
This sophisticated 5 Bd/7 Ba architectural masterpiece on coveted Algonquin Drive offers craftsmanship, soaring ceilings + abundant light. You'll enter via a double-height foyer with detailed millwork.The 1st flr features 10' ceilings + hand-laid oak...
$700,000
$700,000
Available: Right Now
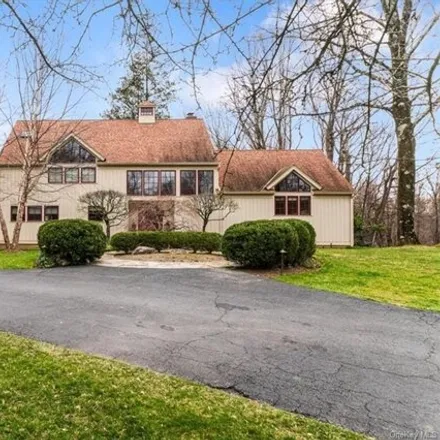
Experience the epitome of Mid-Century Modern living in this captivating secluded retreat, nestled down a country lane. This home, currently configured as a spacious 1-bedroom sanctuary, easily converts back to original design with 2 bedrooms and 1 ba...
$2,5M
$2,5M
Available: Right Now
Welcome to 70 Cowdin Lane! Nestled at the end of a highly sought after private lane in the idyllic town of Chappaqua, this stunning 4-bedroom, 4-bath modern barn-style house is not to be missed! Situated on 2.3 beautiful acres, the residence offers a...
$1,9M
$1,9M
Available: Right Now
This Lawrence Farms East gem offers unparalleled privacy with a long private driveway bordered by linden trees. Enjoy the open floor plan, gas fireplace, cathedral ceilings, and French doors leading to the heated in-ground pool surrounded by flowerin...
$1,8M
$1,8M
Available: Right Now
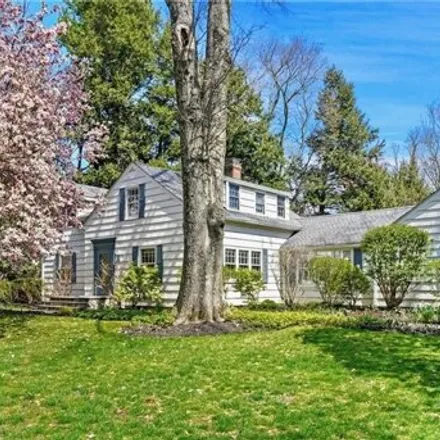
Fabulous 1929 Farm House Colonial meticulously renovated for today's modern living. Dining room w/wood-burning fireplace and large picture windows delightfully blends old-world charm and modern elegance. Awesome, huge, gourmet, designer kitchen w/gia...
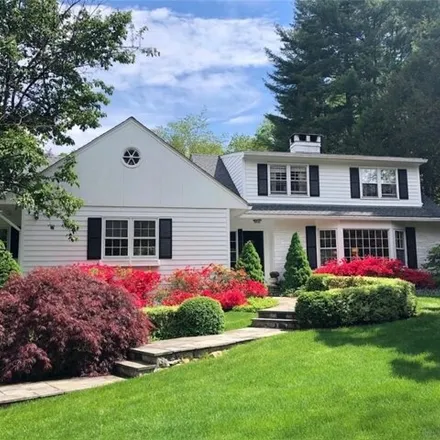
$1,7M
$1,7M
Available: Right Now
Experience the allure of this sunlit 5 Bedroom Colonial nestled in the prestigious Lawrence Farm South neighborhood, exuding character and charm. Situated on a spacious 1.57-acre property, this residence boasts a professionally landscaped and level l...
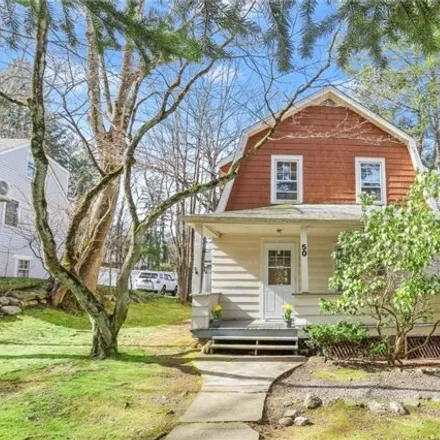
$799,000
$799,000
Available: Right Now
Opportunity to own/invest in two homes on.38 acres of property located in the village of Chappaqua. The front home, #50 has 3 bedrooms, a spacious living room with a wood-burning fireplace, dining room, kitchen, full bathroom, a charming front covere...
$1,3M
$1,3M
Available: Right Now
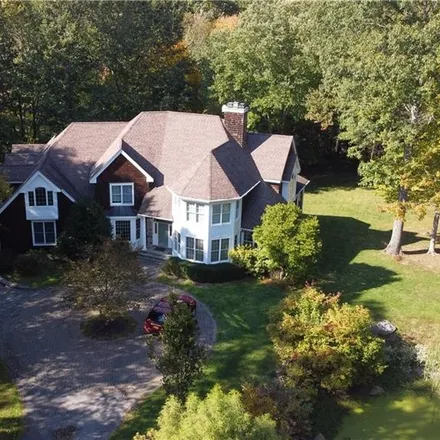
$3,15M
$3,15M
Available: Right Now
Indulge in the ultimate luxury living experience in this exquisite dream home, nestled within a private 4-acre botanical garden. This exceptional property is designed for entertainment and outdoor living, featuring resort-like amenities including an ...
$899,000
$899,000
Available: Right Now
Step into this captivating antique home in Chappaqua NY, dating back to circa 1860, once a part of the historic Henry Allen Cider and Vinegar Factory. Combining old-world charm with modern comforts, this Brooklyn chic residence features original wide...
$1,88M
$1,88M
Available: Right Now
Chappaqua Schools. Beautifully renovated4 BR, 3.5bath colonial on cul-de-sac with spectacular gunite heated pool and child proof pool enclosure. Set on almost an acre of lushly landscaped property with specimen plantings and mature trees. Dramatic en...
$1,08M
$1,08M
Available: Right Now
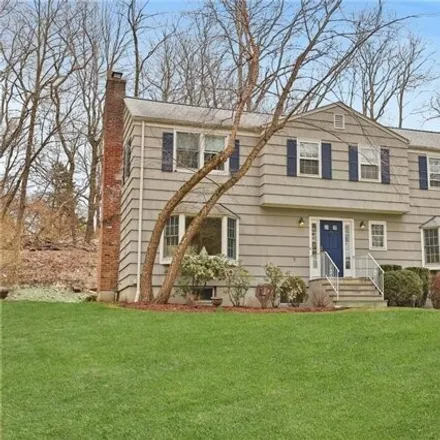
Nestled within Chappaqua's prestigious school district, this charming Colonial is a must see! Boasting four bedrooms, it exudes warmth, highlighted by a comforting wood-burning fireplace in the generously sized formal living room. Sunlight streams th...
$965,000
$965,000
Available: Right Now
Spacious raised ranch-style home, perfect for entertaining on a grand scale. With this elevated design, and ample floor space, this home offers a large living room with fireplace, dining-room, three bathrooms and a grand entertaining room in the lowe...
$2M
$2M
Available: Right Now
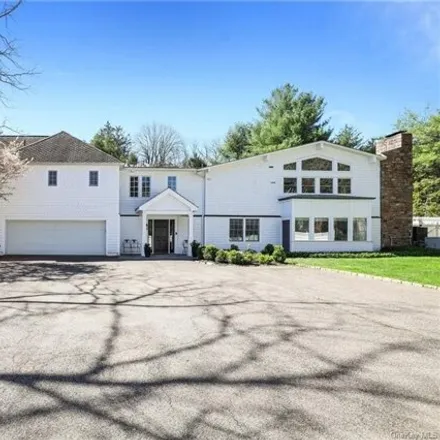
Stunning light filled contemporary home on premier Chappaqua road , lives like 5/6 bedroom with dual home office spaces and flexible floorplan. Renovated sparkling white oversized kitchen/center island/breakfast room windowed on 3 sides opens to fami...
$1,2M
$1,2M
Available: Right Now
Welcome to this fabulous private oasis, nestled among stunning gardens and trellises. This 4 bedroom, 3 full bath home offers an expansive living experience that feels larger than it's square footage. Abundant natural light floods the open layout tha...
$1,35M
$1,35M
Available: Right Now
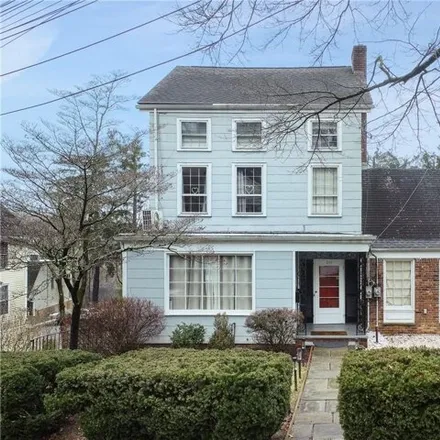
Unique opportunity to own this convenient, in town, multi-use, four-floor building, zoned BR for business and residential use. The current configuration is a 3-story residential unit with a legal accessory apartment and 2 attached income producing re...
$2,5M
$2,5M
Available: Right Now
Immerse yourself in the luxury of this stunning, majestic 5-bedroom, 4 1/2bath, 6, 495sq ft Colonial, located in the prestigious Hardscrabble Lake neighborhood within the renowned Chappaqua School District. This home is a masterpiece of design, featu...
$1,6M
$1,6M
Available: Right Now
Ivy-Clad Stone. One of Chappaqua's most intriguing properties. Located in desirable Hillholme, a 1931 Stone Colonial carefully expanded to incorporate an 1890 Cottage from the historic Taylor estate. Nearly 5200 square feet of sun-filled living space...
Chappaqua
According to statistics, the population in Chappaqua, NY amounts to 1,298, which shows decline -2% compared to the previous year. The median age of the city’s residents is 41. The average household income is $213,040, shifting growth 43% from the past year, and the average property value in Chappaqua, NY growth 13% to $602,500 throughout the year.
| Population | 1,298 |
| Median Age | 40.9 |
| Poverty Rate | 3% |
| Household Income | $213,040 |
| Number Of Employees | 730 |
| Median Property Value | $602,500 |
Household Income
The average household income in Chappaqua, NY grew from $149,205 to $213,040 in the past year. This data is an estimate based upon 493 households in Chappaqua, NY . The chart below presents how household income is distributed in Chappaqua, NY in comparison to the revenue allocation amid households nationally.
Property Value
According to data from last year, the average property value in Chappaqua, NY shifted from $531,000 to $602,500 throughout the year. The subsequent graph indicates the share of properties in the given price range in Chappaqua, NY in comparison to the median property value in the same price segment across the country. According to the data, the greatest share of Chappaqua, NY properties falls in the '$500,000 to $749,999' range, which is higher than the most significant median property across the country.
Rent vs. Own
Property Taxes
One of the most important aspects for property owners is the amount of property taxes. This graph shows distribution of property taxes in Chappaqua, NY compared to median property taxes around the country. The prevalent amount of property taxes in Chappaqua, NY equals $3000, which is less than the national average.