Clayton, IL 62324, USA apartments for sale
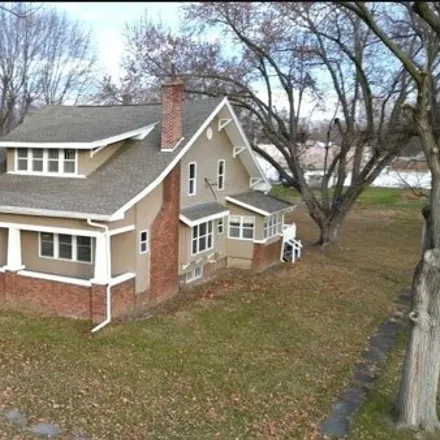
$189,900
$189,900
Available: Right Now
Enjoy the perks of small town living! This fantastic 3 bedroom (could be 4) 2 bathroom home is located on a large, corner lot. In true bungalow style, all of the rooms are oversized and have tons of natural lighting. The current owner has done a comp...
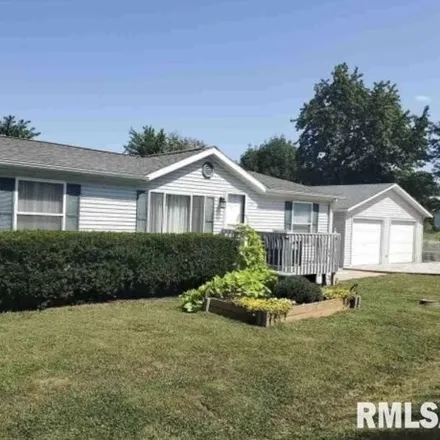
$110,000
$110,000
Available: Right Now
Everything you need all on one level and at a price you an afford. This charming home has so much new in 2020 including HVAC unit. Water heater, all the flooring, stainless steel kitchen appliances, fencing and outbuilding. Fresh paint in 2024 throug...
Clayton
According to statistics, the population in Clayton, IL amounts to 661, which shows growth 9% compared to the previous year. The median age of the city’s residents is 40. The average household income is $31,250, shifting growth 9% from the past year, and the average property value in Clayton, IL decline 1% to $60,900 throughout the year.
What is the Average Price of Apartments for Sale in Clayton, IL, 62324?
| Month | Median Price |
|---|---|
| Mar 2024 |
$270,961
|
| Feb 2024 |
$270,961
|
| Jan 2024 |
$270,961
|
| Dec 2023 |
$270,961
|
| Nov 2023 |
$391,750
|
| Oct 2023 |
$269,527
|
| Month | Median Price |
|---|---|
| Mar 2024 |
$666,025
|
| Feb 2024 |
$666,025
|
| Jan 2024 |
$666,025
|
| Dec 2023 |
$666,025
|
| Nov 2023 |
$408,707
|
| Oct 2023 |
$431,216
|
Household Income
The average household income in Clayton, IL grew from $28,750 to $31,250 in the past year. This data is an estimate based upon 304 households in Clayton, IL . The chart below presents how household income is distributed in Clayton, IL in comparison to the revenue allocation amid households nationally.
Property Value
According to data from last year, the average property value in Clayton, IL shifted from $60,600 to $60,900 throughout the year. The subsequent graph indicates the share of properties in the given price range in Clayton, IL in comparison to the median property value in the same price segment across the country. According to the data, the greatest share of Clayton, IL properties falls in the '$40,000 to $49,999' range, which is lower than the most significant median property across the country.
Property Taxes
One of the most important aspects for property owners is the amount of property taxes. This graph shows distribution of property taxes in Clayton, IL compared to median property taxes around the country. The prevalent amount of property taxes in Clayton, IL equals $800, which is less than the national average.