Dilley, TX 78017, USA apartments for sale
$250,000
$250,000
Available: Right Now
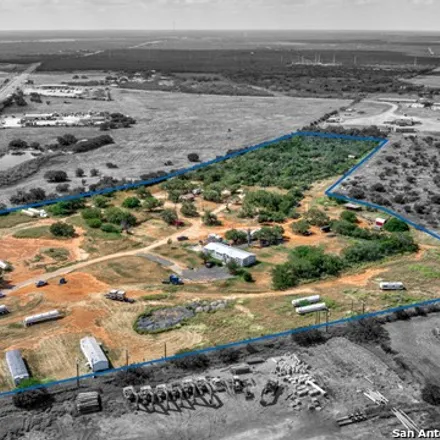
Great Multi Family investment opportunity! This property consists of a 2 bd/1ba Main House with an attached unit 1bd/1ba-no kitchen. Property features 2 detached buildings - with 2 units per building. One building, each unit features 2 bds/1ba. The s...
$2,1M
$2,1M
Available: Right Now
$200,000
$200,000
Available: Right Now
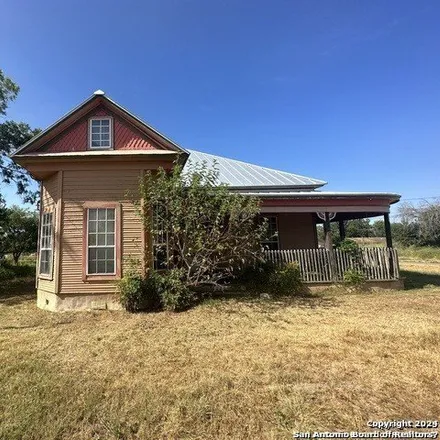
Investors special Get ready to roll up your sleeves and turn this property into a charming dollhouse! With its high ceilings, open floor plan, and loads of charm, this place has incredible potential. Additionally, the detached quarters can be ...
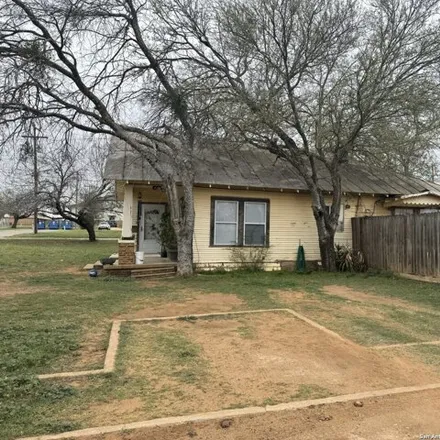
$155,000
$155,000
Available: Right Now
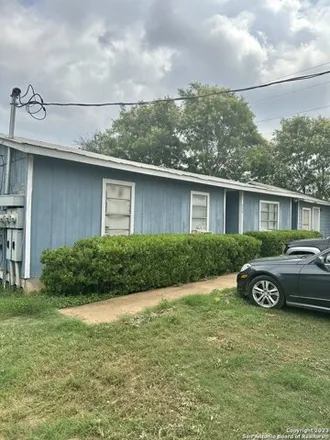
Investor property. This property is being soldAS IS.It is priced low for a Quick sale ! Less than a mile away from downtown Dilley, and close proximity to the school. This property has 4 rentals, 1 storage building, and 2 additional buildings ...
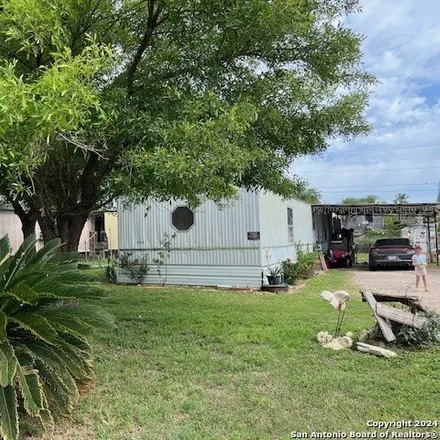
$80,000
$80,000
Available: Right Now
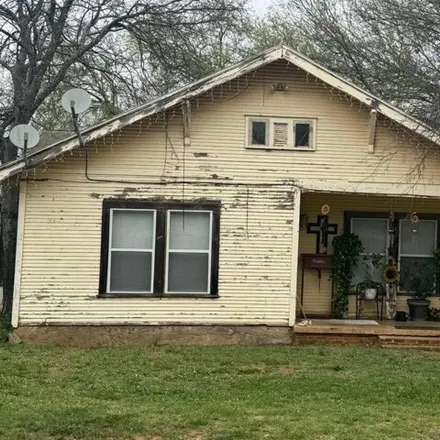
Nice Location with easy access toIH 35.Home has had some up grade's to the bath rooms and flooring., plywood floors.( needs some fishing touches) Back yard suited for the animals and a beautiful front yard with mature trees. Come see this nice home b...
$155,000
$155,000
Available: Right Now
Investor property. This property is being soldAS IS.It is priced low for a Quick sale ! Less than a mile away from downtown Dilley, and close proximity to the school. This property has 4 rentals, 1 storage building, and 2 additional buildings ...
Dilley
According to statistics, the population in Dilley, TX amounts to 4,269, which shows growth 2% compared to the previous year. The median age of the city’s residents is 26. The average household income is $31,118, shifting decline -1% from the past year, and the average property value in Dilley, TX decline -18% to $37,000 throughout the year.
Household Income
The average household income in Dilley, TX declined from $31,518 to $31,118 in the past year. This data is an estimate based upon 687 households in Dilley, TX . The chart below presents how household income is distributed in Dilley, TX in comparison to the revenue allocation amid households nationally.
Property Value
According to data from last year, the average property value in Dilley, TX shifted from $45,000 to $37,000 throughout the year. The subsequent graph indicates the share of properties in the given price range in Dilley, TX in comparison to the median property value in the same price segment across the country. According to the data, the greatest share of Dilley, TX properties falls in the '$60,000 to $69,999' range, which is lower than the most significant median property across the country.
Property Taxes
One of the most important aspects for property owners is the amount of property taxes. This graph shows distribution of property taxes in Dilley, TX compared to median property taxes around the country. The prevalent amount of property taxes in Dilley, TX equals $800, which is less than the national average.