Fall River, KS 67047, USA apartments for sale
$125,000
$125,000
Available: Right Now
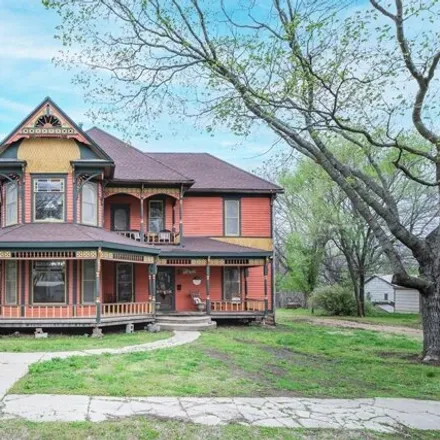
Welcome to this beautifully restored two-story Victorian home nestled in the heart of Fall River. This charming residence has undergone meticulous renovations to bring back its original allure while incorporating modern amenities. As you step inside,...
Fall River
According to statistics, the population in Fall River, KS amounts to 127, which shows decline -16% compared to the previous year. The median age of the city’s residents is 48. The average household income is $38,333, shifting decline -19% from the past year, and the average property value in Fall River, KS n/a% to $36,500 throughout the year.
What is the Average Price of Apartments for Sale in Fall River, KS, 67047?
| Month | Median Price |
|---|---|
| Mar 2024 |
$415,508
|
| Feb 2024 |
$415,508
|
| Jan 2024 |
$415,508
|
| Dec 2023 |
$415,508
|
| Nov 2023 |
$406,374
|
| Oct 2023 |
$442,912
|
| Month | Median Price |
|---|---|
| Mar 2024 |
$426,033
|
| Feb 2024 |
$426,033
|
| Jan 2024 |
$426,033
|
| Dec 2023 |
$426,033
|
| Nov 2023 |
$425,180
|
| Oct 2023 |
$455,809
|
Household Income
The average household income in Fall River, KS declined from $47,500 to $38,333 in the past year. This data is an estimate based upon 64 households in Fall River, KS . The chart below presents how household income is distributed in Fall River, KS in comparison to the revenue allocation amid households nationally.
Property Value
According to data from last year, the average property value in Fall River, KS shifted from $36,500 to $36,500 throughout the year. The subsequent graph indicates the share of properties in the given price range in Fall River, KS in comparison to the median property value in the same price segment across the country. According to the data, the greatest share of Fall River, KS properties falls in the '$50,000 to $59,999' range, which is lower than the most significant median property across the country.
Property Taxes
One of the most important aspects for property owners is the amount of property taxes. This graph shows distribution of property taxes in Fall River, KS compared to median property taxes around the country. The prevalent amount of property taxes in Fall River, KS equals $800, which is less than the national average.