Fish Camp, CA 93623, USA apartments for sale
$899,000
$899,000
Available: Right Now
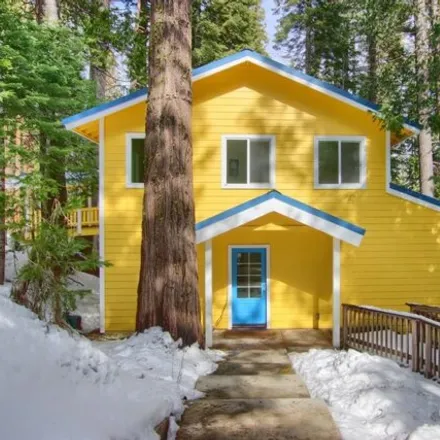
Located a 5 minute walk from Tenaya Lodge resort and spa and just 2 miles from Yosemites entrance station, this large house features 6 beds, 5 full baths and 2 laundry rooms (1 on each level). 4 of the bedrooms have their own ensuite full baths. Rece...
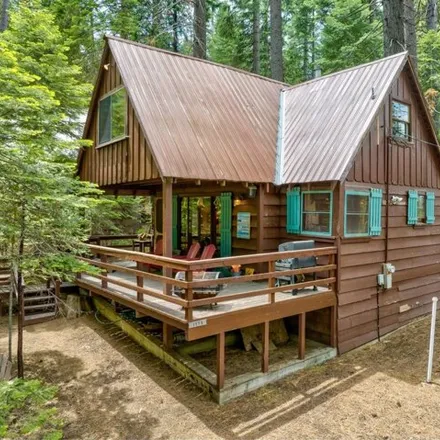
$798,000
$798,000
Available: Right Now
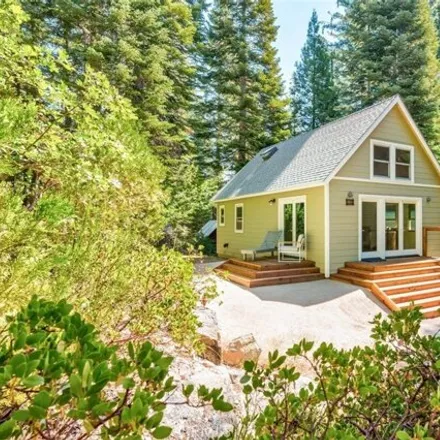
Welcome to your private mountain retreat! The new entirely re-built cabin is totally charming in an excellent Fish Camp location just outside the Yosemite National Park gate! With a main 1 bedroom, 1 1/2bath cabin and a renovated 1 bedroom, 1 bath gu...
$550,000
$550,000
Available: Right Now
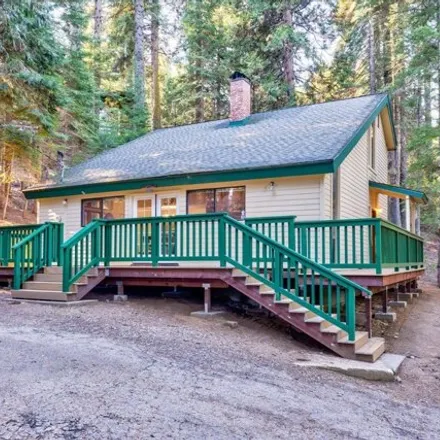
Charming mountain cabin surrounded by amazing local scenery, in the coveted village of Fish Camp, California, just 2-3 minutes from the scenic splendor of Yosemite National Park. Spacious living room has super large custom masonry wood burning firepl...
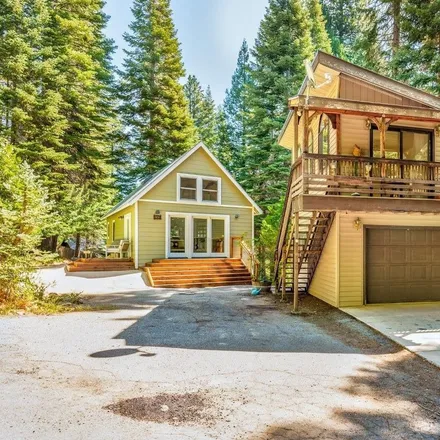
$775,000
$775,000
Available: Right Now
$425,000
$425,000
Available: Right Now
This Adorable Completely Furnished cabin in Fish Camp is a rare find!!!!! Do not let the square footage fool you! Every inch of this charming cabin is perfectly designed and can actually sleep 8 people. Just minutes to the entrance to Yosemite, Bass ...
Fish Camp
According to statistics, the population in Fish Camp, CA amounts to 83, which shows decline -3% compared to the previous year. The median age of the city’s residents is 69. The average household income is $n/a, shifting n/a% from the past year, and the average property value in Fish Camp, CA n/a% to $n/a throughout the year.
Household Income
The average household income in Fish Camp, CA grew from $n/a to $n/a in the past year. This data is an estimate based upon 40 households in Fish Camp, CA . The chart below presents how household income is distributed in Fish Camp, CA in comparison to the revenue allocation amid households nationally.
Property Value
According to data from last year, the average property value in Fish Camp, CA shifted from $n/a to $n/a throughout the year. The subsequent graph indicates the share of properties in the given price range in Fish Camp, CA in comparison to the median property value in the same price segment across the country. According to the data, the greatest share of Fish Camp, CA properties falls in the '$300,000 to $399,999' range, which is higher than the most significant median property across the country.
Property Taxes
One of the most important aspects for property owners is the amount of property taxes. This graph shows distribution of property taxes in Fish Camp, CA compared to median property taxes around the country. The prevalent amount of property taxes in Fish Camp, CA equals $1750, which is less than the national average.