Haviland, KS 67059, USA apartments for sale
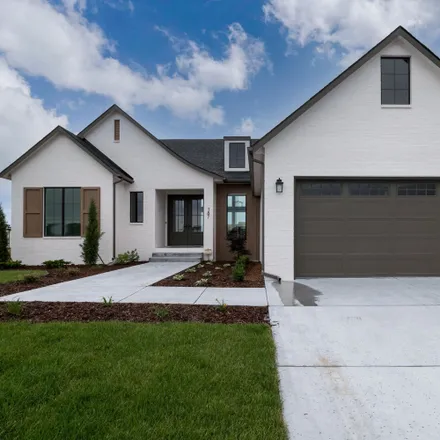
$728,577
$728,577
Available: Right Now
Haviland
According to statistics, the population in Haviland, KS amounts to 738, which shows decline 0% compared to the previous year. The median age of the city’s residents is 30. The average household income is $48,021, shifting growth 6% from the past year, and the average property value in Haviland, KS growth 2% to $84,200 throughout the year.
Household Income
The average household income in Haviland, KS grew from $45,156 to $48,021 in the past year. This data is an estimate based upon 223 households in Haviland, KS . The chart below presents how household income is distributed in Haviland, KS in comparison to the revenue allocation amid households nationally.
Property Value
According to data from last year, the average property value in Haviland, KS shifted from $82,200 to $84,200 throughout the year. The subsequent graph indicates the share of properties in the given price range in Haviland, KS in comparison to the median property value in the same price segment across the country. According to the data, the greatest share of Haviland, KS properties falls in the '$80,000 to $89,999' range, which is lower than the most significant median property across the country.
Property Taxes
One of the most important aspects for property owners is the amount of property taxes. This graph shows distribution of property taxes in Haviland, KS compared to median property taxes around the country. The prevalent amount of property taxes in Haviland, KS equals $1150, which is less than the national average.