Hyampom, CA 96046, USA apartments for sale
$395,000
$395,000
Available: Right Now

$266,000
$266,000
Available: Right Now
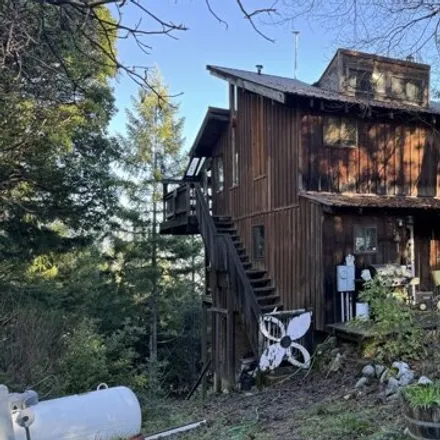
Clean water, water, water everywhere! Remote cabin on South Fork Mountain with a spectacular view. Gravity water system with 300 gallon recovery per hour (per seller) with2, 000gallons of storage. Solidly built cabin with metal roof, three newly rebu...
$299,000
$299,000
Available: Right Now
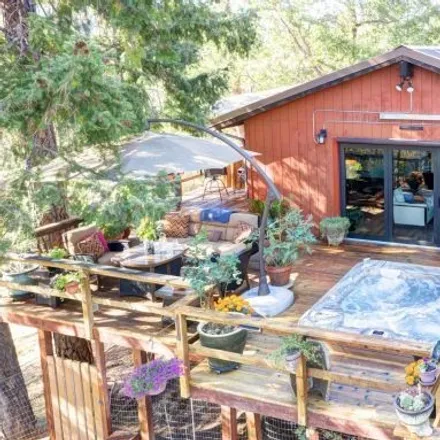
This 2 bedroom, 2 bath home sits on 40 sprawling acres on the top of the mountain with the most beautiful views. This custom home is open and bright with high ceilings and features a wood stove to keep you warm and cozy in the winter months. Upstairs...
$99,000
$99,000
Available: Right Now
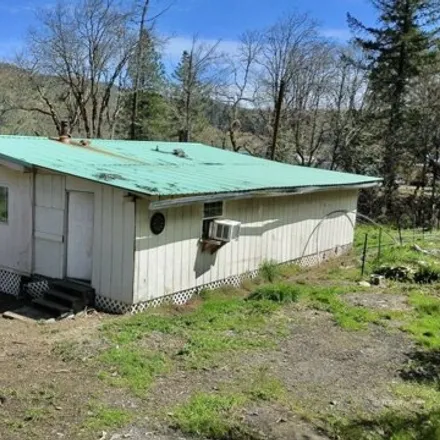
This fixer is located close to the South Fork of the Trinity River and walking distance to great swimming and fishing spots along the river is where you will find this 2 bed/1 bath manufactured home with an addition. Serene views from the covered bac...
$266,000
$266,000
Available: Right Now
Clean water, water, water everywhere! Remote cabin on South Fork Mountain with a spectacular view. Gravity water system with 300 gallon recovery per hour (per seller) with2, 000gallons of storage. Solidly built cabin with metal roof, three newly rebu...
Hyampom
According to statistics, the population in Hyampom, CA amounts to 63, which shows decline -53% compared to the previous year. The median age of the city’s residents is 46. The average household income is $n/a, shifting n/a% from the past year, and the average property value in Hyampom, CA n/a% to $n/a throughout the year.
Household Income
The average household income in Hyampom, CA grew from $n/a to $n/a in the past year. This data is an estimate based upon 29 households in Hyampom, CA . The chart below presents how household income is distributed in Hyampom, CA in comparison to the revenue allocation amid households nationally.
Property Value
According to data from last year, the average property value in Hyampom, CA shifted from $n/a to $n/a throughout the year. The subsequent graph indicates the share of properties in the given price range in Hyampom, CA in comparison to the median property value in the same price segment across the country. According to the data, the greatest share of Hyampom, CA properties falls in the '$400,000 to $499,999' range, which is higher than the most significant median property across the country.
Property Taxes
One of the most important aspects for property owners is the amount of property taxes. This graph shows distribution of property taxes in Hyampom, CA compared to median property taxes around the country. The prevalent amount of property taxes in Hyampom, CA equals $1150, which is less than the national average.