Little River, CA, USA apartments for sale
$1,55M
$1,55M
Available: Right Now
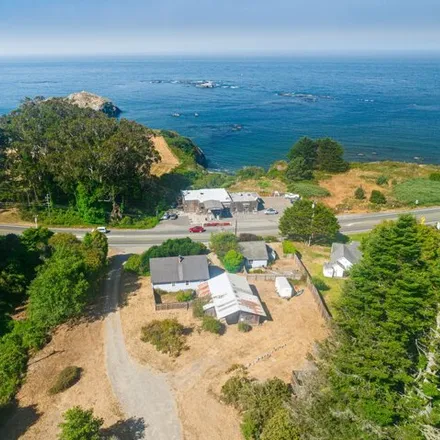
Three houses, three parcels plus a barn and an additional vacant building, conveniently located adjacent to the Little River Inn, it's fine dining and golf course, and across Highway 1 from the Little River Market and Post Office. VanDamme State Park...
$2M
$2M
Available: Right Now
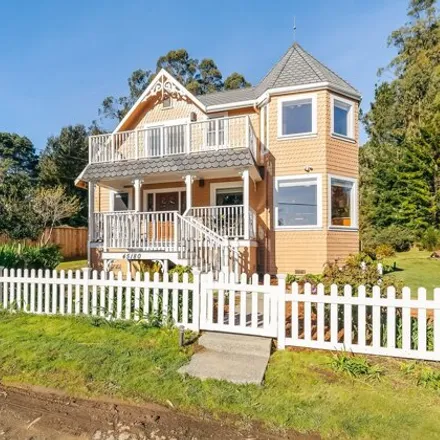
Step back in time to discover this meticulously restored Victorian home, originally built in 1862 by Master Ship Builder Thomas Petersen. It was in the bay below, that he created 14 of his most famed schooners. This beauty is a rare fusion of histori...

$2,3M
$2,3M
Available: Right Now
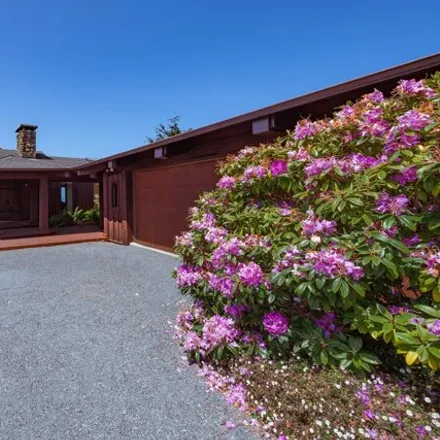
The Residence at Seal Rock: The beauty of California's rugged and ever-changing North Coast is celebrated in this spectacular 2-bedroom, 2.5 bath oceanfront home located just 40 feet from cliff's edge. Using the strength and character of reclaimed br...
$899,000
$899,000
Available: Right Now
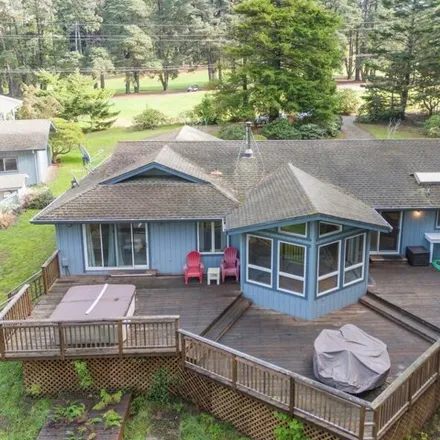
Perfectly sited at the end of a peaceful and private road, this lovely 3 bedroom, 2.5 bath home features a soaring prow front living room, wood floors and light filled rooms. The living room flows into the spacious kitchen with ample cabinets and a l...
$2,3M
$2,3M
Available: Right Now
The Residence at Seal Rock: The beauty of California's rugged and ever-changing North Coast is celebrated in this spectacular 2-bedroom, 2.5 bath oceanfront home located just 40 feet from cliff's edge. Using the strength and character of reclaimed br...
Little River
According to statistics, the population in Little River, CA amounts to 82, which shows decline -22% compared to the previous year. The median age of the city’s residents is 65. The average household income is $n/a, shifting n/a% from the past year, and the average property value in Little River, CA n/a% to $n/a throughout the year.
| Population | 82 |
| Median Age | 65.4 |
| Poverty Rate | 85% |
| Number Of Employees | 16 |
Household Income
The average household income in Little River, CA grew from $n/a to $n/a in the past year. This data is an estimate based upon 75 households in Little River, CA . The chart below presents how household income is distributed in Little River, CA in comparison to the revenue allocation amid households nationally.
Property Value
According to data from last year, the average property value in Little River, CA shifted from $n/a to $n/a throughout the year. The subsequent graph indicates the share of properties in the given price range in Little River, CA in comparison to the median property value in the same price segment across the country. According to the data, the greatest share of Little River, CA properties falls in the '$750,000 to $999,999' range, which is higher than the most significant median property across the country.
Rent vs. Own
Property Taxes
One of the most important aspects for property owners is the amount of property taxes. This graph shows distribution of property taxes in Little River, CA compared to median property taxes around the country. The prevalent amount of property taxes in Little River, CA equals $3000, which is less than the national average.