Londonderry, NH, USA apartments for sale
$1,2M
$1,2M
Available: Right Now
Welcome to Nadeau Village! A community of 15 Multi-Generational homes in Hudson NH. The Main House features 3 bedrooms, 2 1/2baths, hardwood flooring, granite counters, 2 car garage, central air, master suite with walk in closet and private bath with...
$899,900
$899,900
Available: Right Now
Price reduced !!! Desirable 4-Unit Apartment Building - Ideal for Owner Occupant or Investor that wants an easy to oversee investment property with an excellent opportunity for potential growth with rents currently below market. Spacious and w...
$414,900
$414,900
Available: Right Now
$744,900
$744,900
Available: Right Now
$274,900
$274,900
Available: Right Now
$442,000
$442,000
Available: Right Now
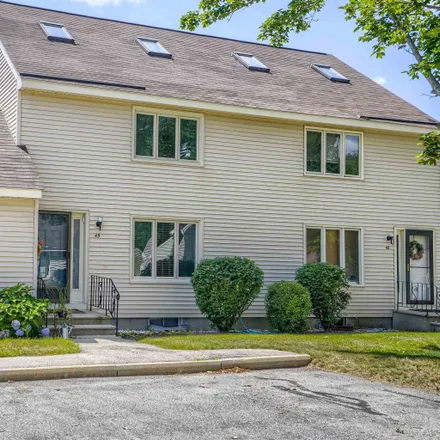
Welcome to the village at Braemar Woods where you will find yourself off the beaten path yet close to shopping and highway access. Check out this two-bedroom townhouse where the primary bedroom leads up to a spacious loft with skylight for home offic...
$385,000
$385,000
Available: Right Now
Fabulous 3 bedroom in the desirable Mountain Home Estates. This home has been remarkably maintained and updated by current owner! The kitchen has seen a full renovation, cabinets, backsplash, granite countertops, including all new stainless steel app...
$775,000
$775,000
Available: Right Now
$385,154
$385,154
Available: Right Now
$1,4M
$1,4M
Available: Right Now
Only 9 Left! Welcome to Nadeau Village! A community of 15 multigenerational homes in Hudson NH. The Taylor features 4 bedrooms, 3 1/2baths, hardwood flooring, granite counters, 2 car garage, central air, primary suite with walk in closet and private ...
$149,000
$149,000
Available: Right Now
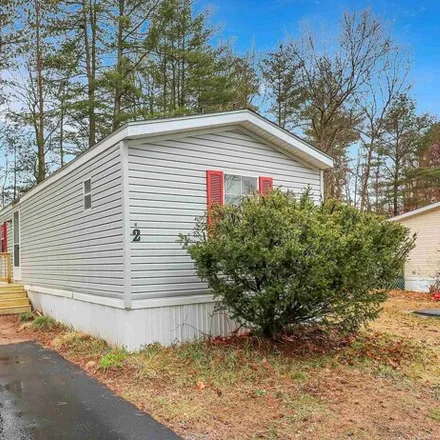
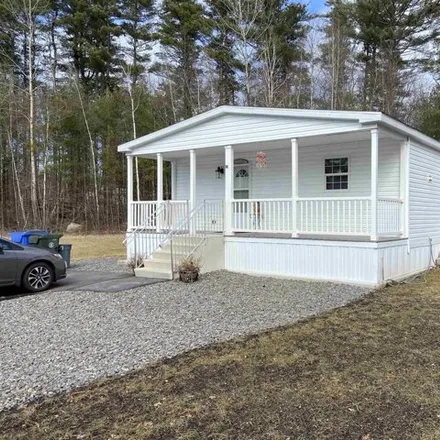
Welcome home sweet home! This charming 3-bedroom, 2-bathroom manufactured home is brimming with potential. Whether you're a first-time homeowner eager to infuse your style into every corner or someone looking to downsize and simplify without compromi...
$869,000
$869,000
Available: Right Now
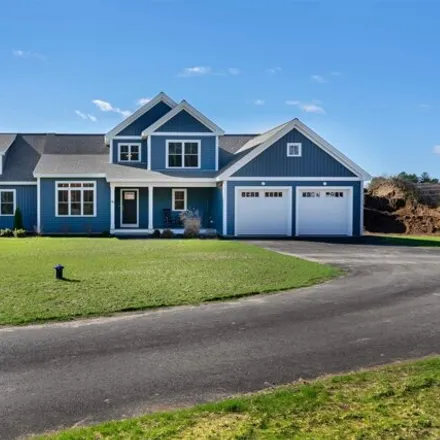
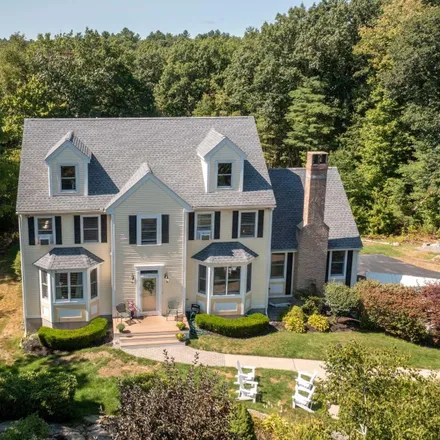
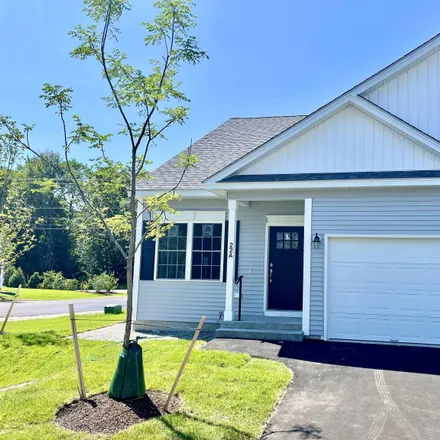
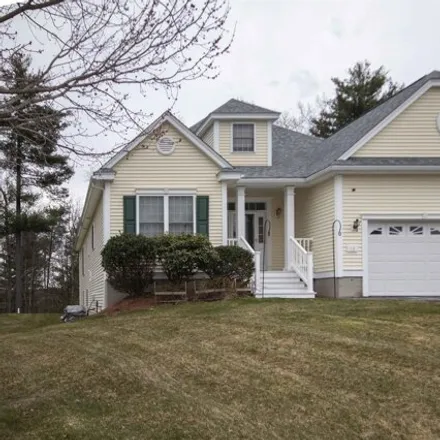
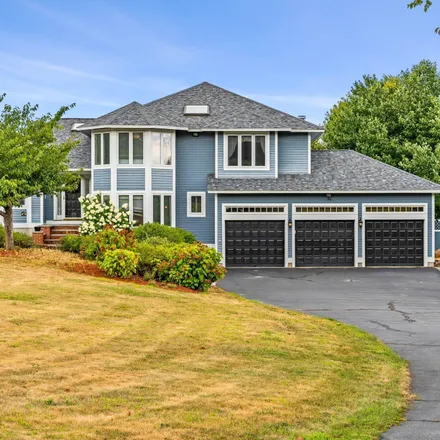
Welcome to 8 Nettie Way! This sophisticated, almost brand new home is situated atop a hill, providing captivating views. It is at the end of a cul-de-sac in one of the best neighborhoods in Londonderry. Its layout showcases an expansive open-concept ...
$625,000
$625,000
Available: Right Now
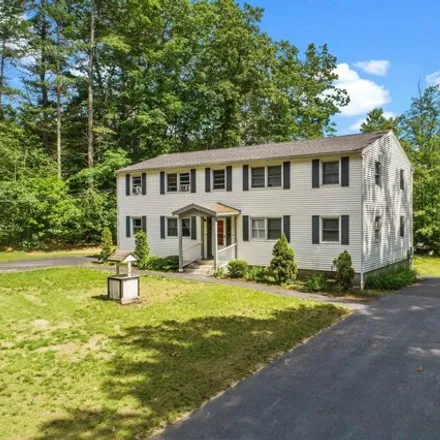
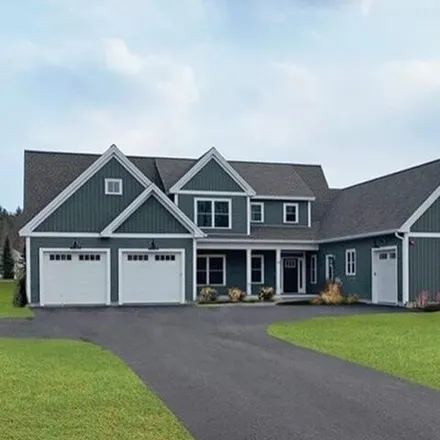
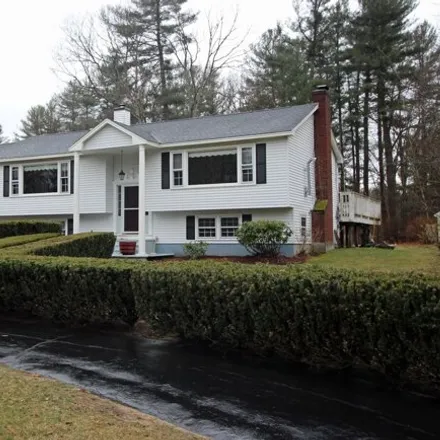
Exceptional Split Level home with classic style and sharp curb appeal set on a level 1 acre lot in Londonderry! This fantastic home delivers big on the inside, freshly painted and offering 2, 800+ sq/ft of living space, beautiful hardwoods, bright an...
$700,000
$700,000
Available: Right Now
$199,900
$199,900
Available: Right Now
Like New! This home has only been lived in for just a year.! Great condo alternative, single family home at the end of cul-de-sac. Very quiet neighborhood with all new, same style homes! This is a ranch style double-wide manufactured home with one le...
$579,900
$579,900
Available: Right Now
Welcome to the Forest Hills of Londonderry 55+ community. Nothing to do here but move in and enjoy this well maintained home. Pride of ownership shines throughout. Recent improvements include: roof (March 2023), Furnace (Oct. 2022). Lovely open floor...
$995,000
$995,000
Available: Right Now
$515,000
$515,000
Available: Right Now
$399,000
$399,000
Available: Right Now
$425,000
$425,000
Available: Right Now
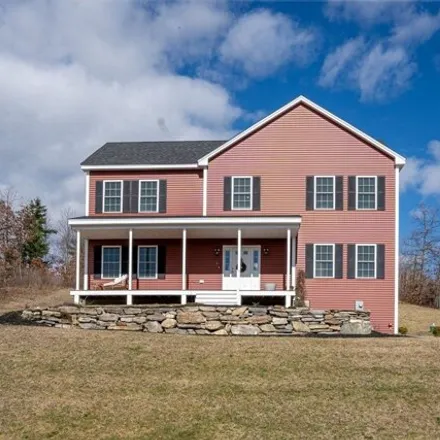
Welcome to a charming home in the sought-after Trolley Crossing neighborhood, where functionality meets comfort in this split-entry Colonial. With its distinct Gambrel roof and an inviting open floor plan, this residence offers the perfect blend of s...
$300,000
$300,000
Available: Right Now
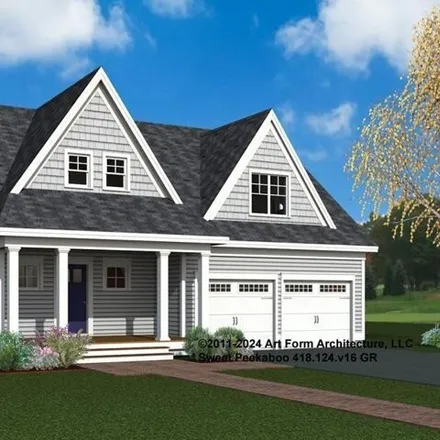
$804,900
$804,900
Available: Right Now
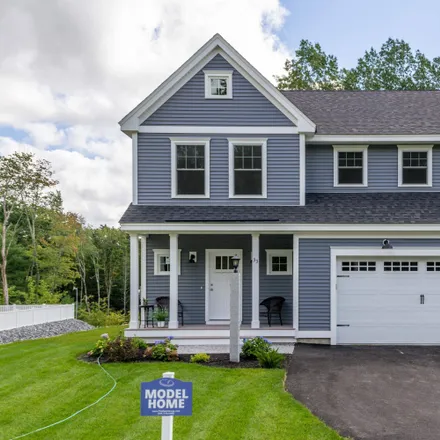
The last buildable lots at Lorden Commons are finally here! While long-awaited, this floor plan checks a lot of boxes; not to mention residency in this coveted established Londonderry community. The Sweet Peekaboo is a 2061 square foot three-bedroom ...
Londonderry
According to statistics, the population in Londonderry, NH amounts to 11,313, which shows growth 2% compared to the previous year. The median age of the city’s residents is 43. The average household income is $87,652, shifting growth 2% from the past year, and the average property value in Londonderry, NH growth 5% to $288,900 throughout the year.
| Population | 11,313 |
| Median Age | 42.8 |
| Poverty Rate | 4% |
| Household Income | $87,652 |
| Number Of Employees | 6,468 |
| Median Property Value | $288,900 |
Household Income
The average household income in Londonderry, NH grew from $85,893 to $87,652 in the past year. This data is an estimate based upon 4,160 households in Londonderry, NH . The chart below presents how household income is distributed in Londonderry, NH in comparison to the revenue allocation amid households nationally.
Property Value
According to data from last year, the average property value in Londonderry, NH shifted from $276,200 to $288,900 throughout the year. The subsequent graph indicates the share of properties in the given price range in Londonderry, NH in comparison to the median property value in the same price segment across the country. According to the data, the greatest share of Londonderry, NH properties falls in the '$300,000 to $399,999' range, which is higher than the most significant median property across the country.
Rent vs. Own
Property Taxes
One of the most important aspects for property owners is the amount of property taxes. This graph shows distribution of property taxes in Londonderry, NH compared to median property taxes around the country. The prevalent amount of property taxes in Londonderry, NH equals $3000, which is less than the national average.