Long Branch, NJ 07740, USA apartments for sale
$950,000
$950,000
Available: Right Now
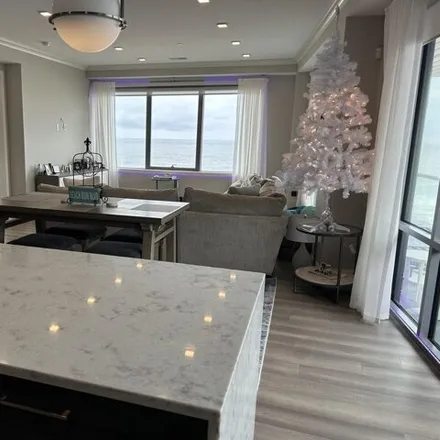
Stunning2 Bedroom Condo just completed In Harbour Mansion. This Ocean Front Building offers full amenities including 2 meeting rooms or recreation rooms , gym , indoor pool, assigned cabana, cabana attendant to set up chairs and umbrellas on the beac...
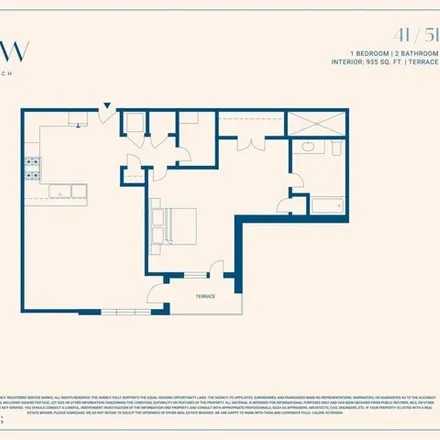
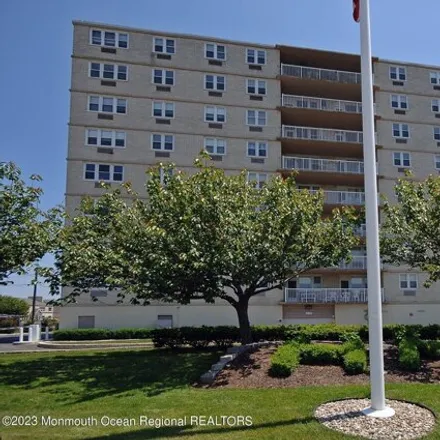
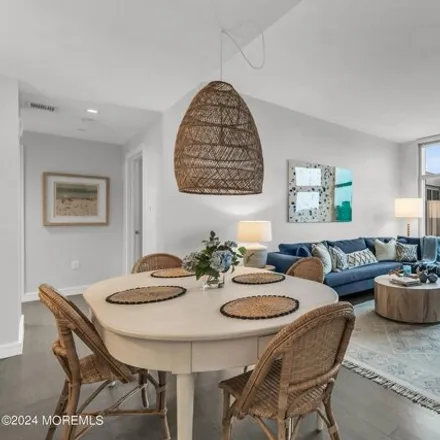
$600,000
$600,000
Available: Right Now
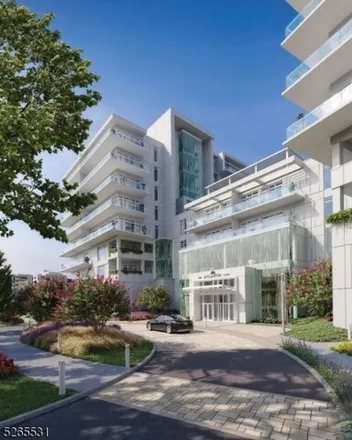
New Construction Condominium! The View Long Branch where modern and upscale living meets the serenity of a beach community. The View is comprised of 36 residences. Resident features include oversized kitchen and bedrooms, 9ft ceilings, luxury vinyl f...
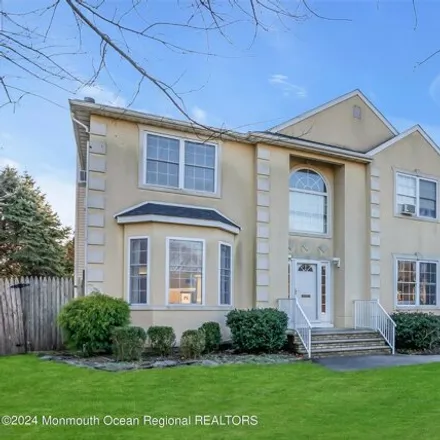
$2,1M
$2,1M
Available: Right Now
This 3500 sq ft Colonial boasts a grand double-story entry, 5 bedrooms, 3.5 baths on a spacious 102x140 lot. The grand kitchen with corian counters and center island, along with hardwood floors throughout, exudes elegance. The primary suite features ...
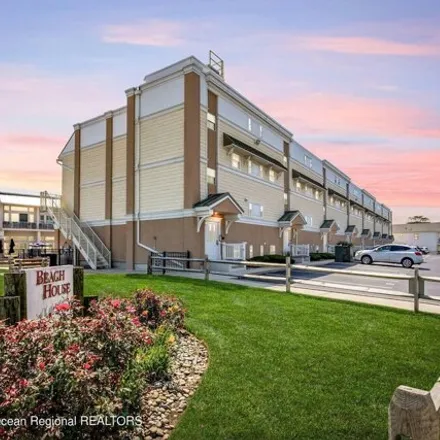
$998,000
$998,000
Available: Right Now
Welcome to a fantastic opportunity to own a slice of paradise nestled along the sun-kissed shores of Long Branch@the Beach House. This captivating beachfront condo offers the epitome of coastal living, a retreat where the harmonious blend of luxury a...
$1,57M
$1,57M
Available: Right Now
Welcome to a luxurious lifestyle at the Pier Village Lofts. This stunning condo offers a modern hotel-like design, Front door concierge, perfect for those seeking upscale living. Inside the penthouse unit, meticulous maintenance is evident throughout...
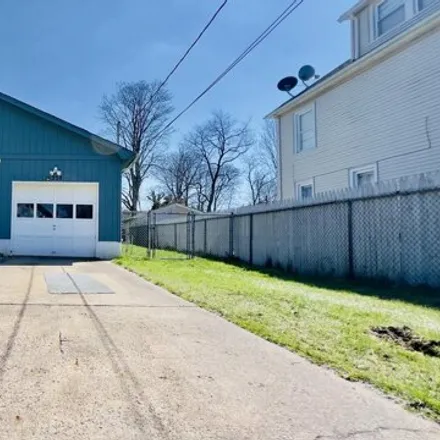
$595,000
$595,000
Available: Right Now
Experience the allure of coastal living at this expansive and contemporary Ranch-style nestled in the heart of Long Branch. This updated home boasts a sleek design and a coveted location, just moments away from the beach, Pier Village, acclaimed dini...
$3,29M
$3,29M
Available: Right Now
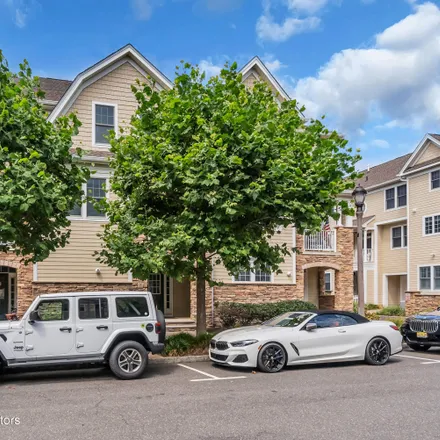
Discover the pinnacle of seaside elegance in this exquisite brand new 5 bedroom, 5 bathroom ocean view townhome nestled in the heart of the beautiful seaside community of Long Branch. The Reef offers the very best of luxurious living with a host of e...
$1,53M
$1,53M
Available: Right Now
This is a coming soon listing and cannot be shown until 4/4. Great shore colonial that been totally renovated sitting on 62x253 lot. Beautiful kitchen with custom cabinets, stainless appliances, and stone counters with large island. Gorgeous hardwood...
$369,000
$369,000
Available: Right Now
This is a coming soon listing and can't be shown until Friday, 4/5/2024.Interior photos will be posted on Thursday. Upper level end unit with a balcony, located just one block from the beach! This spacious 1 bed 1 bath condo features hardwood floors ...
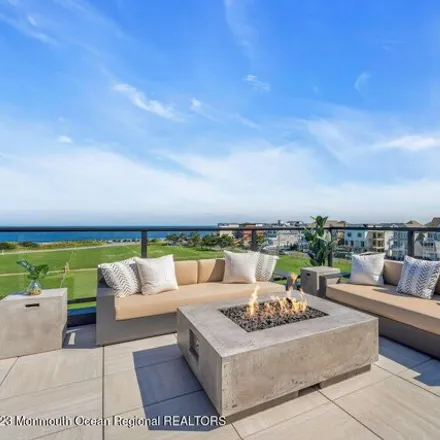
$2,35M
$2,35M
Available: Right Now
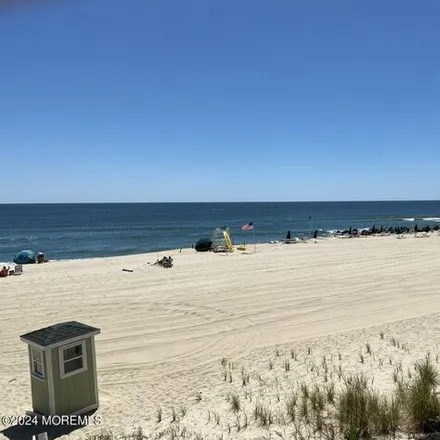
Indulge in the epitome of coastal living with this meticulous 2-bedroom, 2-bath condominium with an added bonus room perfectly situated on the Jersey Shore. Offering breathtaking ocean views from every room and unparalleled amenities, The heart of th...
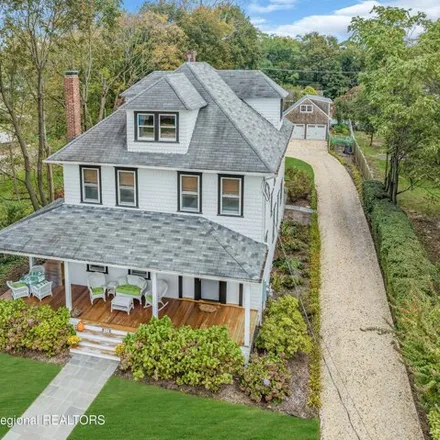
$1,3M
$1,3M
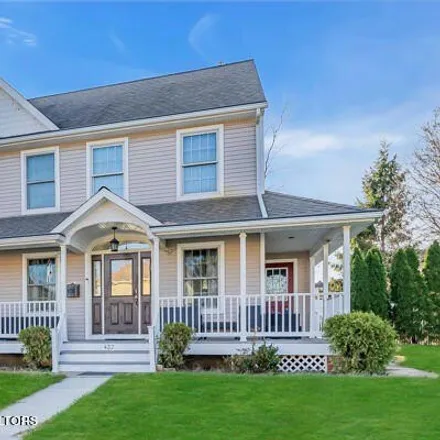
Available: Right Now
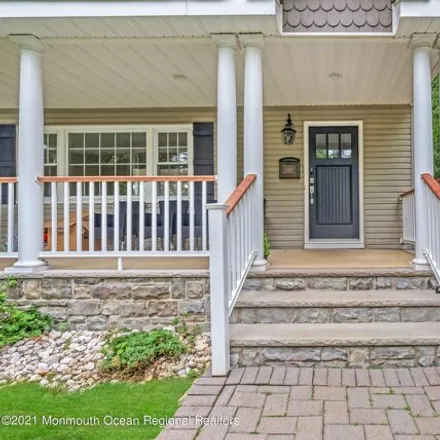
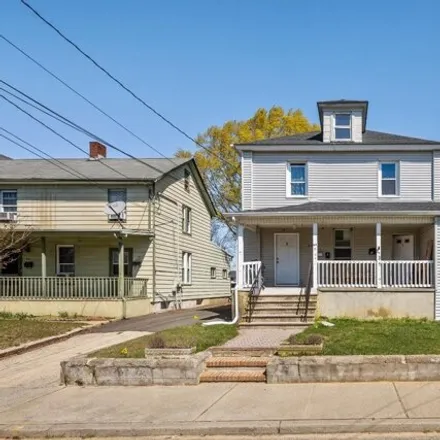
Home Is Where The Heart Is At !! Enjoy Front Porch all year round in this Beautiful Charming Home that has 4 Bedrooms, 2 1/2Bathrooms, Living Room, Dining Room, Kitchen With Center Island, and A Wonderful Family Room that has lots of Sunlight and vie...
$1,3M
$1,3M
Available: Right Now
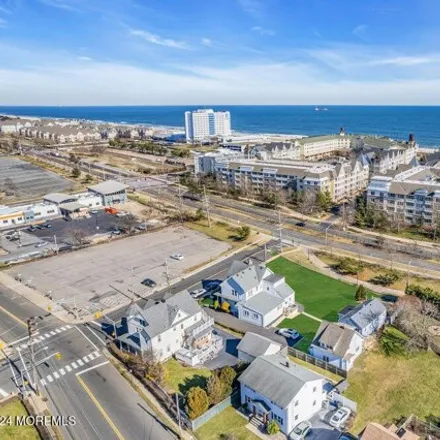
Please also refer to mls # 22403715. long branch location at the corner of ocean blvd opposite pier village. 82 chelsea avenue ( Which includes 82 and 84) Is only being sold together with 80 chelsea avenue as one package with ...
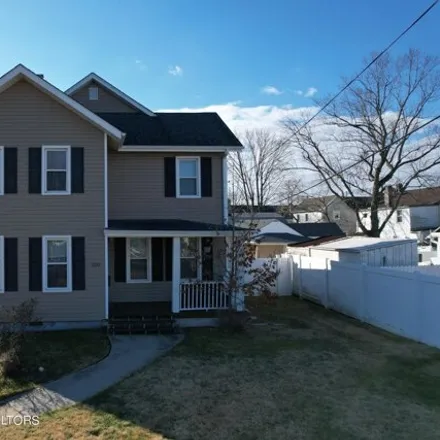
$799,000
$799,000
Available: Right Now
Find your perfect home on the Shore. Stunning Colonial home with high ceilings, airy and clear atmosphere, kitchen with new appliances and beautiful granite countertops. With an inviting porch making the way to a warm and spacious family room filled ...
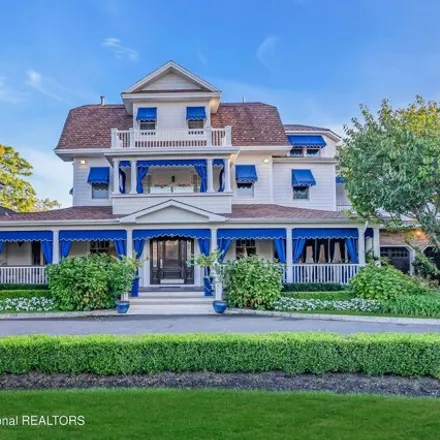
$7,5M
$7,5M
Available: Right Now
Step into your exclusive Grand Shore Estate, nestled on nearly 1 acre of land. This meticulously reconstructed Shore Colonial Jewel seamlessly blends modern innovations with timeless charm. With 8 bedrooms, 7 full baths, and 2 half baths, spanning al...
$1,5M
$1,5M
Available: Right Now
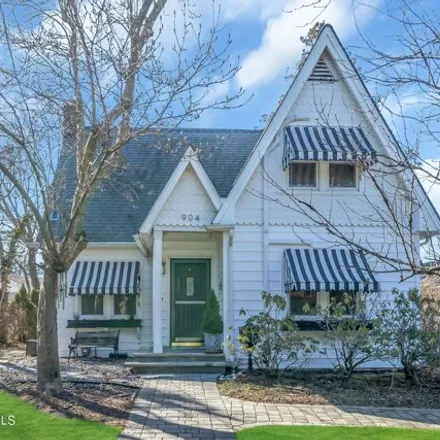
$989,000
$989,000
Available: Right Now
Enter into this warm charming home and just relax! Beautiful hard wood floors, Living room, formal dining room, Lovely kitchen with granite countertops, plenty of cabinets and built in's, Large living room with warm fireplace, High ceilings and plent...
$1,6M
$1,6M
Available: Right Now
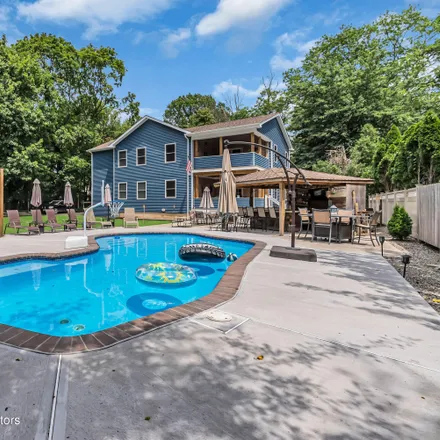
$929,000
$929,000
Available: Right Now
Rare opportunity to own an immaculate colonial with inground swimming pool on quiet cul de sac in one of the hottest growing neighborhoods in Long Branch! House features modern open layout concept, wood floors, recessed lighting, amazing primary bedr...
$1,66M
$1,66M
Available: Right Now
The Atlantic Club is a collection of 132 condominium residences. Many features include private terrace and or balcony. Over75, 000square feet of indoor and outdoor amenities focused on wellness and entertaining. Ocean front resort pool deck, multi-fu...
$1,2M
$1,2M
Available: Right Now
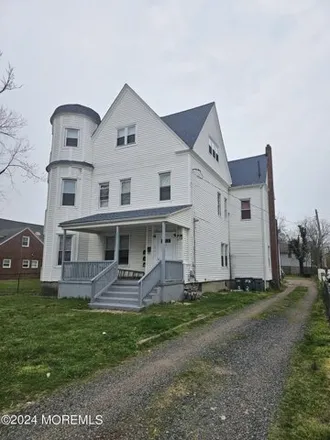
Welcome to your next income-generating opportunity in Long Branch, NJ! This expansive 3-family house is strategically located close to the beaches and train station, offering convenience and potential for a lucrative investment. Key features of this ...
$953,000
$953,000
Available: Right Now
This spacious 3-family home offers a lucrative investment opportunity with tenants already in place.Each unit boasts its own unique layout with generous living spaces, including multiple bedrooms, bathrooms, kitchens, and living areas.This property s...
$1,2M
$1,2M
Available: Right Now
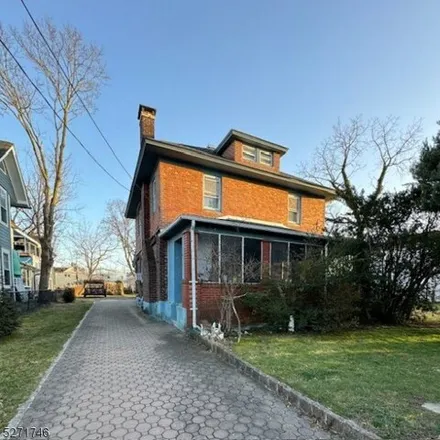
Welcome to this 4 bedroom and 2 full baths Brick Colonial Home nestled in Long Branch. Features original woodwork, a wood burning fireplace and a charming enclosed front porch. First floor boasts 1 bedroom, living room, dining room, eat in kitchen an...
Long Branch
According to statistics, the population in Long Branch, NJ amounts to 30,751, which shows decline 0% compared to the previous year. The median age of the city’s residents is 37. The average household income is $54,398, shifting growth 6% from the past year, and the average property value in Long Branch, NJ growth 6% to $337,000 throughout the year.
Household Income
The average household income in Long Branch, NJ grew from $51,435 to $54,398 in the past year. This data is an estimate based upon 11,921 households in Long Branch, NJ . The chart below presents how household income is distributed in Long Branch, NJ in comparison to the revenue allocation amid households nationally.
Property Value
According to data from last year, the average property value in Long Branch, NJ shifted from $318,600 to $337,000 throughout the year. The subsequent graph indicates the share of properties in the given price range in Long Branch, NJ in comparison to the median property value in the same price segment across the country. According to the data, the greatest share of Long Branch, NJ properties falls in the '$300,000 to $399,999' range, which is higher than the most significant median property across the country.
Property Taxes
One of the most important aspects for property owners is the amount of property taxes. This graph shows distribution of property taxes in Long Branch, NJ compared to median property taxes around the country. The prevalent amount of property taxes in Long Branch, NJ equals $3000, which is less than the national average.