McAllen, TX, USA apartments for sale
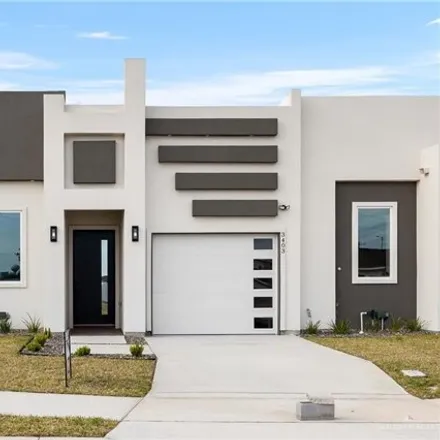
$259,900
$259,900
Available: Right Now
Welcome to Queens Court, a newly construction townhome community. This unit features 3 bedrooms, 2 full bathrooms with high decorative ceilings, walk in closets, quartz countertops and beautiful faux wood porcelain tile floors. Among the luxurious fi...
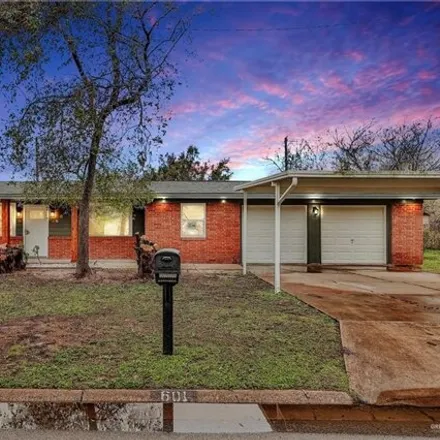
$269,000
$269,000
Available: Right Now
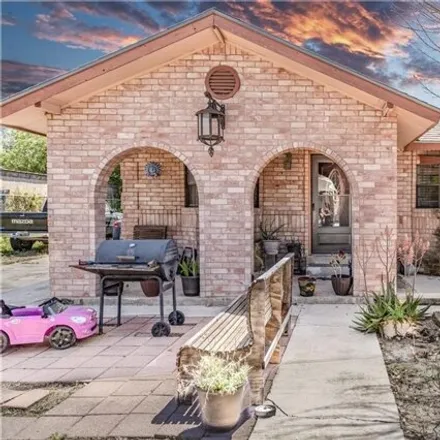
This gorgeous home offers four bedrooms, two baths, an office/den/workshop and a completely updated, move-in ready interior plus living quarters with a privacy hallway! Find exquisite luxury features including led and recessed lighting, magnificent f...
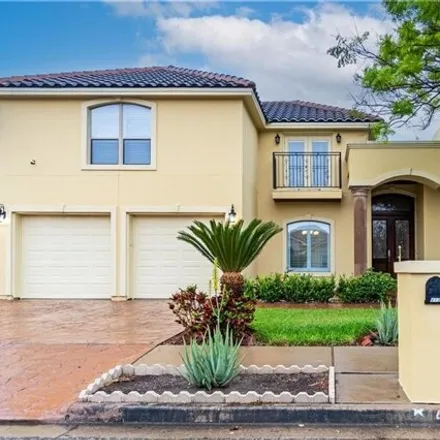
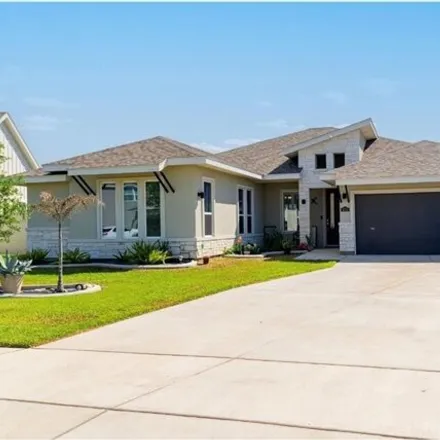
$459,000
$459,000
Available: Right Now
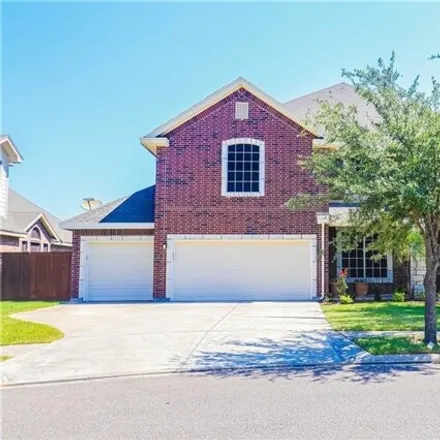
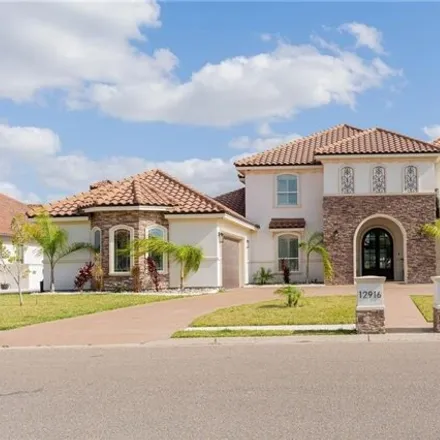
Stunning home for Sale in the heart of the prestigious area of North McAllen. This gorgeous 2 Story home has a spacious floor plan and features 4 bedrooms, 3.5 baths, formal living, and dining rooms, a family room, upstairs bonus room currently tv ar...
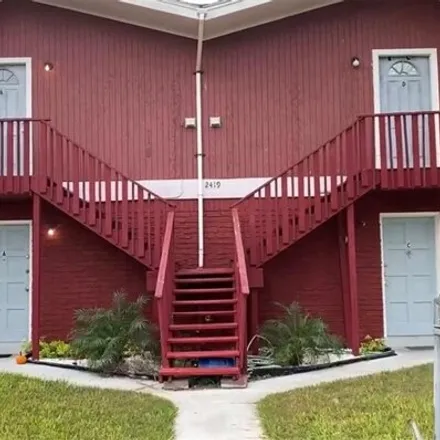
$320,000
$320,000
Available: Right Now
Investors get ready! Don't wait for a Fixer Upper....this 4-Plex is already an income producing property occupied with long term tenants. Each unit has 2 bedrooms and 1 bath with central A/C, refrigerator and stove/oven range. This passive income pro...
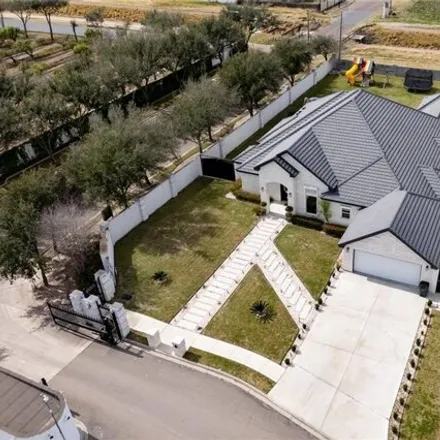
$599,000
$599,000
Available: Right Now
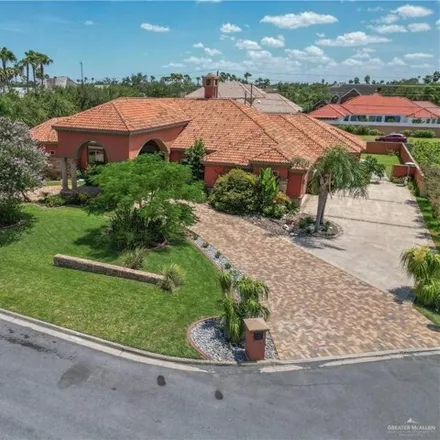
Amazing two-story 3 Car Garage custom-built vacation home in Sharyland Plantation. It features 5 Bedrooms and 5 bathrooms, 4 half bathrooms, two Living Rooms, two Dining Areas, a Bar Area downstairs, a Game Room and a Theater Room. This home also has...
$1,2M
$1,2M
Available: Right Now
Luxury in the heart of mcallen !!! This 5 bed, 5 bath masterpiece is located in one of McAllen's most coveted exclusive subdivisions in the heart of the medical plaza. This home offers elegance and comfort with a spacious living area that feat...
$275,000
$275,000
Available: Right Now
Charming home for sale in the heart of McAllen. The heart of this home is its open-concept living area, where the living room seamlessly flows into the kitchen and dining spaces. This property features 3 bedrooms 2 full baths, 2 living areas and 1 di...
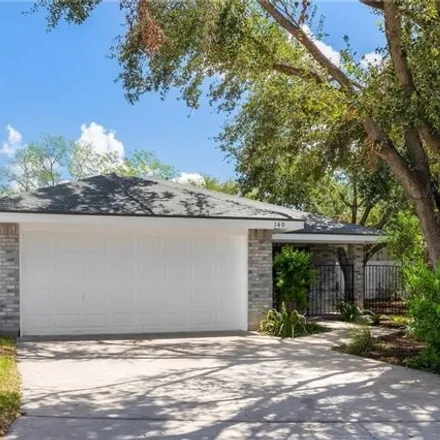
$179,000
$179,000
Available: Right Now
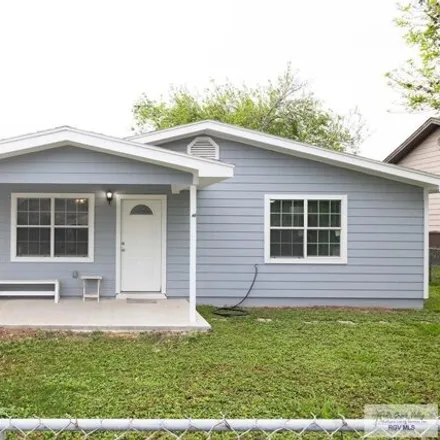
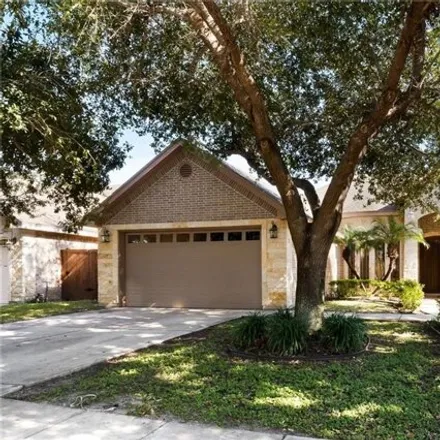
Great location off the expressway in Pharr. Updated and remodeled home ready to move in and start making memories. This home offers 3 large bedrooms and 2 full baths. Home was updated in 2021 with a new roof, AC units, double pane windows, water heat...
$149,000
$149,000
Available: Right Now
Welcome to 304 Monica Street, a captivating residence nestled in the heart of Palmhurst, TX. This charming 2-bedroom, 2-bathroom home offers a perfect blend of comfort, style, and functionality, all set on a generous 0.15-acre lot. With a total livin...
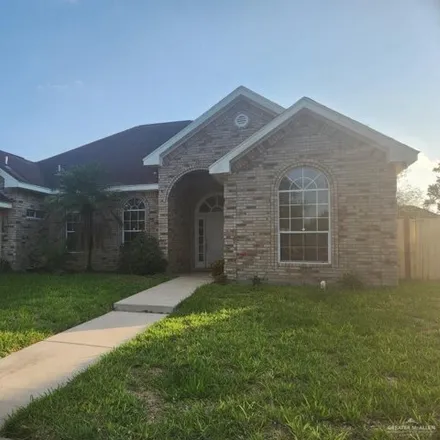
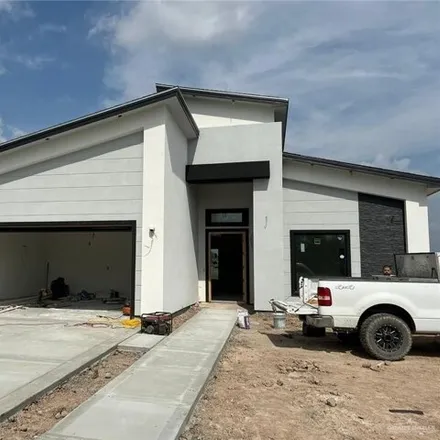
$345,000
$345,000
Available: Right Now
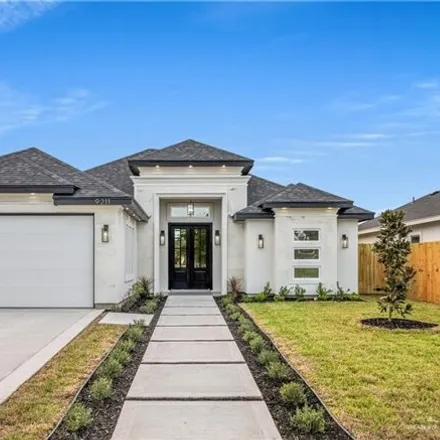
New construction ! Located in a new neighborhood in North McAllen . excellent location !! university and major retail stores are less than a 10 minute drive! This new construction has 3 bedroom/2.5 baths and features a very open space l...
$159,000
$159,000
Available: Right Now
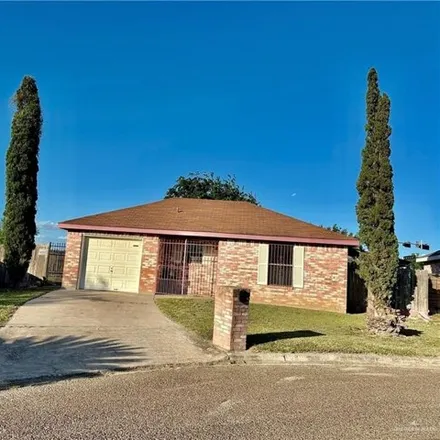
Location, Location!! Perfectly Located starter home in North McAllen. This house features 2 bedrooms and 1 bath with 1 car garage. On cul de sac lot and minutes from shopping, restaurants and North 10th St. Perfect for a young professional or a start...
$1,33M
$1,33M
Available: Right Now
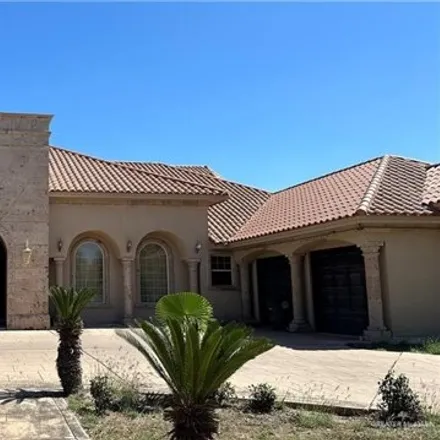
Welcome to your dream Mediterranean-style home located in the prestigious San Miguel subdivision in Sharyland Plantation. This property features 5 bedrooms and 5.5 bathrooms that are perfect to accommodate family and guests. The chef's kitchen comes ...
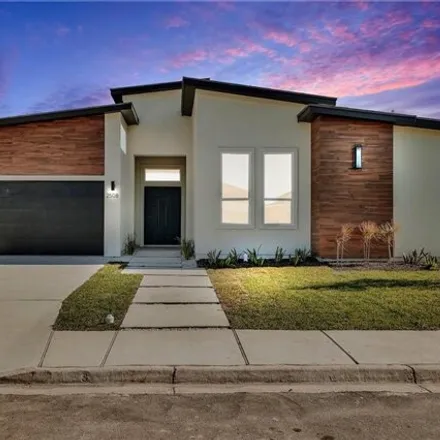
$394,000
$394,000
Available: Right Now
Welcome to luxury living in the prestigious Ensenada Subdivision at Tres Lagos! This exquisite home boasts an open concept layout with 4 bedrooms and 4 baths, including a convenient mother-in-law suite. The spacious kitchen, a chef's dream, is adorne...
$219,000
$219,000
Available: Right Now
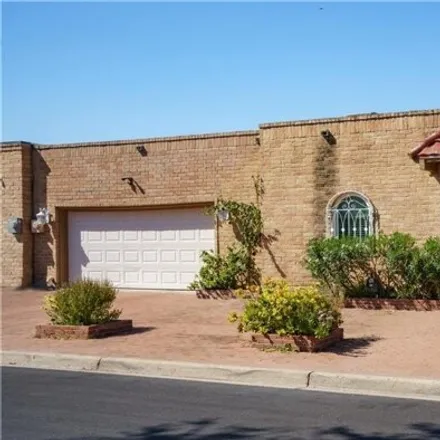
Calling All Leasing Investors or First Time Home Buyers!Introducing a stunning newly remodeled property that promises to captivate you from the moment you step in. This one-story gem boasts an exquisite interior remodel that includes fresh paint, upd...
$325,000
$325,000
Available: Right Now
Beautiful Sharyland School District home with 4 generously sized bedrooms including 2 primary suites, 3 bathrooms and large kitchen. Low maintenance tile flooring throughout and decorative high ceilings. Extra-large primary suite with jacuzzi bath, d...
$399,000
$399,000
Available: Right Now
Stunning new construction home built by Brito Construction nestled in a prime location near major stores, expressway, restaurants, and hospital. Upon entry you will notice the tile flooring throughout the home, high ceilings that amplify the space an...
$1,35M
$1,35M
Available: Right Now
Decadent luxury awaits you in this grand home in the coveted upscale Malmaison Luxe at Trinity!Beautifully landscaped this 6bd/4.5 bth beauty sits on.50 of an acre.Spacious layout in main living and formal dining area for guest adorned with beautiful...
$332,000
$332,000
Available: Right Now
Welcome HOME and Step inside your future and beautifully constructed home designed to exceed your expectations! With approximately 1802 sq ft of living area, you'll have ample space to create beautiful family memories. Don't miss this incredible oppo...
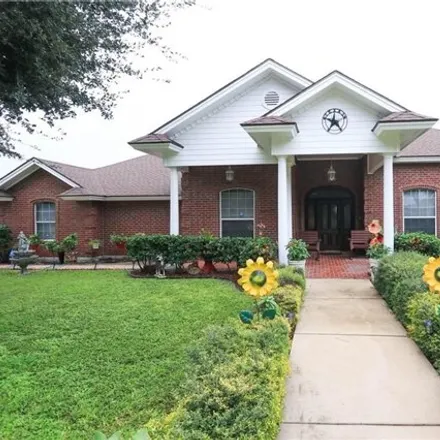
$444,900
$444,900
Available: Right Now
Beautiful well-built home in a wonderfully established neighborhood in central Mission. This 5 bedroom / 3.5 bath home with an office/study features high ceilings, a secondary master bedroom, spacious bedrooms, granite countertops with custom wood ca...
$299,000
$299,000
Available: Right Now
Under construction 3 bedroom 2 and a half bath home located in Mayberry Meadows Subdivision. The model home is available to tour. Finishing will be similar to the model home. Upon entering, you're greeted by an open-concept layout that effortlessly c...
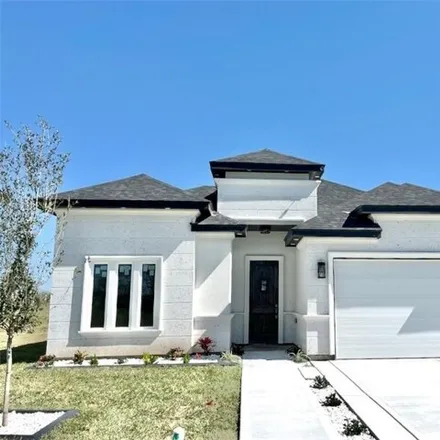
$329,000
$329,000
Available: Right Now
Step into your new home! This 3-bedroom, 3-bathroom residence is nestled in the Sharyland school district offering an open design effortlessly linking a spacious living area to the formal dining room leading into the breakfast nook. Find solace in th...
$950,000
$950,000
Available: Right Now
Welcome to your dream home situated on a spacious 1/2 acre lot in the exclusive gated subdivision of The Vineyards. This stunning property boasts 5 bedrooms and 4.5 bathrooms, a theater room, private office, and a bonus entertainers bar/game room, pr...
McAllen
According to statistics, the population in McAllen, TX amounts to 139,838, which shows decline 1% compared to the previous year. The median age of the city’s residents is 33. The average household income is $45,057, shifting decline -1% from the past year, and the average property value in McAllen, TX growth 3% to $120,500 throughout the year.
| Population | 139,838 |
| Median Age | 32.9 |
| Poverty Rate | 25% |
| Household Income | $45,057 |
| Number Of Employees | 58,587 |
| Median Property Value | $120,500 |
Household Income
The average household income in McAllen, TX declined from $45,568 to $45,057 in the past year. This data is an estimate based upon 43,987 households in McAllen, TX . The chart below presents how household income is distributed in McAllen, TX in comparison to the revenue allocation amid households nationally.
Property Value
According to data from last year, the average property value in McAllen, TX shifted from $117,500 to $120,500 throughout the year. The subsequent graph indicates the share of properties in the given price range in McAllen, TX in comparison to the median property value in the same price segment across the country. According to the data, the greatest share of McAllen, TX properties falls in the '$100,000 to $124,999' range, which is lower than the most significant median property across the country.
Rent vs. Own
Property Taxes
One of the most important aspects for property owners is the amount of property taxes. This graph shows distribution of property taxes in McAllen, TX compared to median property taxes around the country. The prevalent amount of property taxes in McAllen, TX equals $3000, which is less than the national average.