Smiley, TX, USA apartments for sale
$109,000
$109,000
Available: Right Now
$109,900
$109,900
Available: Right Now
$346,999
$346,999
Available: Right Now
$159,500
$159,500
Available: Right Now
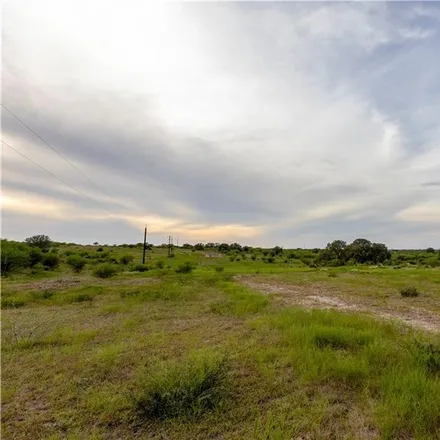
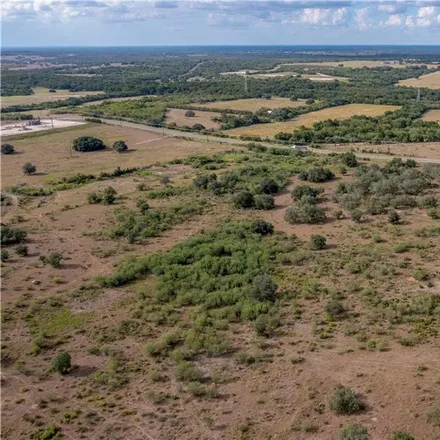
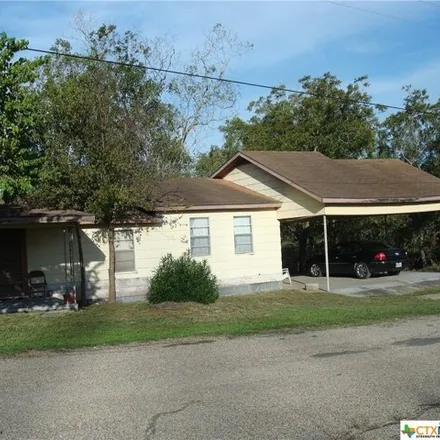
Needs work!! But what a great opportunity. Situated on almost an acre of land and with road frontage on two sides. This diamond in the rough older home has spacious rooms throughout and is located in the quaint town of Smiley....
Smiley
According to statistics, the population in Smiley, TX amounts to 536, which shows decline -14% compared to the previous year. The median age of the city’s residents is 36. The average household income is $40,000, shifting decline -6% from the past year, and the average property value in Smiley, TX decline -9% to $54,700 throughout the year.
| Population | 536 |
| Median Age | 35.6 |
| Poverty Rate | 17% |
| Household Income | $40,000 |
| Number Of Employees | 215 |
| Median Property Value | $54,700 |
Household Income
The average household income in Smiley, TX declined from $42,344 to $40,000 in the past year. This data is an estimate based upon 174 households in Smiley, TX . The chart below presents how household income is distributed in Smiley, TX in comparison to the revenue allocation amid households nationally.
Property Value
According to data from last year, the average property value in Smiley, TX shifted from $60,000 to $54,700 throughout the year. The subsequent graph indicates the share of properties in the given price range in Smiley, TX in comparison to the median property value in the same price segment across the country. According to the data, the greatest share of Smiley, TX properties falls in the '$50,000 to $59,999' range, which is lower than the most significant median property across the country.
Rent vs. Own
Property Taxes
One of the most important aspects for property owners is the amount of property taxes. This graph shows distribution of property taxes in Smiley, TX compared to median property taxes around the country. The prevalent amount of property taxes in Smiley, TX equals $800, which is less than the national average.