Warrenton, VA, USA apartments for sale
$1,24M
$1,24M
Available: Right Now
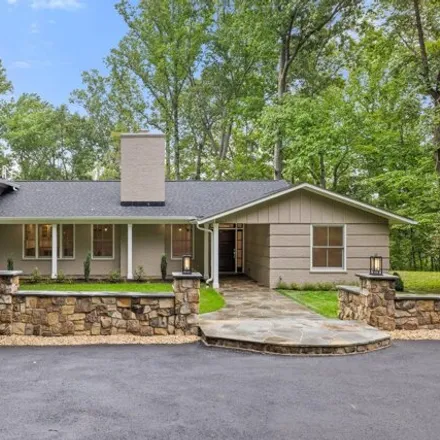
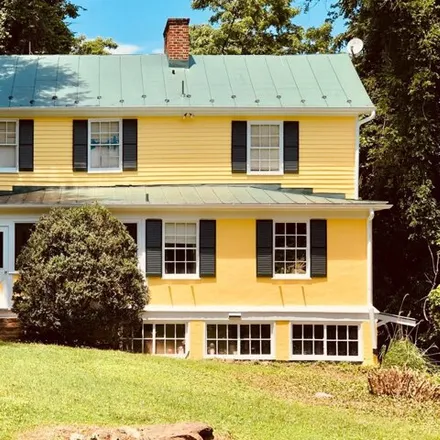
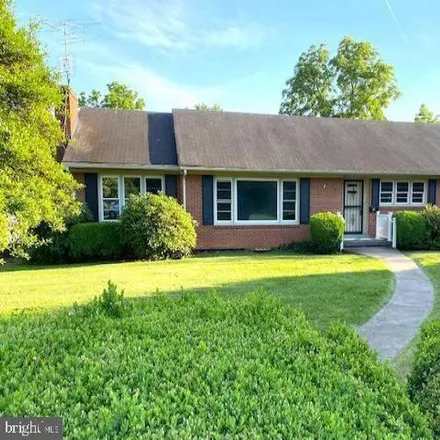
Stone walls and walkways welcome you home to this meticulously renovated mid-century gem tucked away just under a high point on an expansive 24.90-acre lot, overlooking a spring-fed pond which opens to lower fields bounded by Cedar Run for the entire...
$681,900
$681,900
Available: Right Now
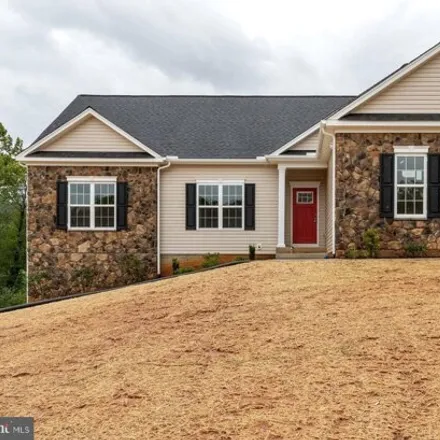
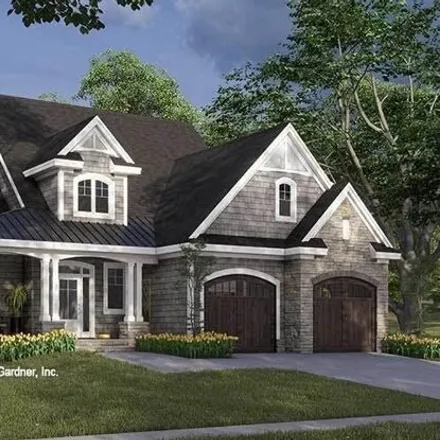
L ocated in the heart of the town warrenton, a short walk to main st/courthouse/shopping/restaurants. this home is to be built. builder is a semi-custom builder , will allows changes to his floor plans-will build to suit. see view docs. we have se...
$899,990
$899,990
Available: Right Now
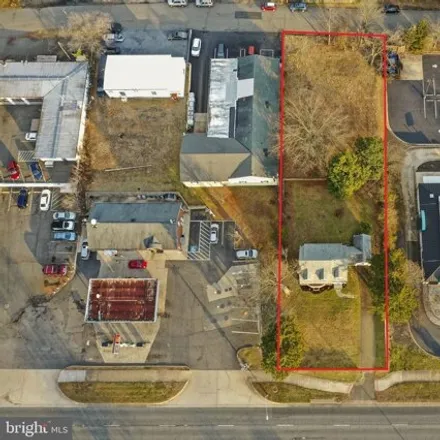
This is a Commercial Listing Exciting opportunity awaits with Lot 23 and 109 Broadview in Warrenton, VA! This prime parcel of land offers the perfect canvas for your dream investment project. Located in a desirable area, Lot 23 provides ample space f...
$775,000
$775,000
Available: Right Now
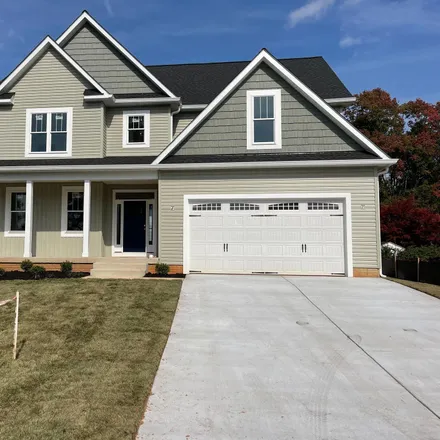
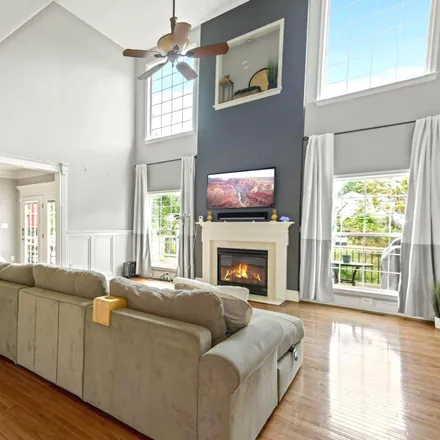
Check out the latest pics we are moving along, everything is ordered and i will update often. schedule a peak ! Atkins homes can solve that problem! This home is under roof, dry walled and can be ready by December. Introducing the Washi...
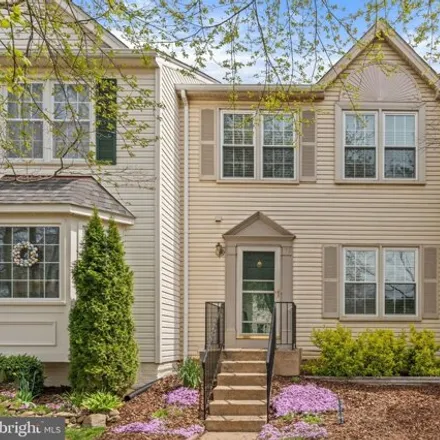
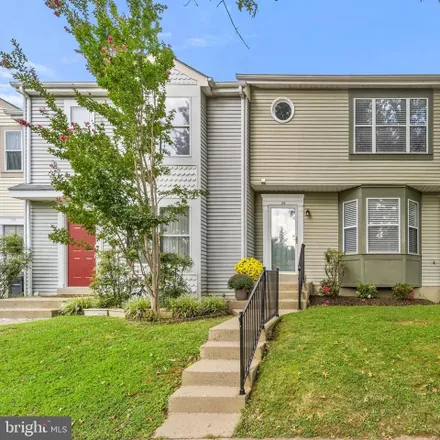
$405,000
$405,000
Available: Right Now
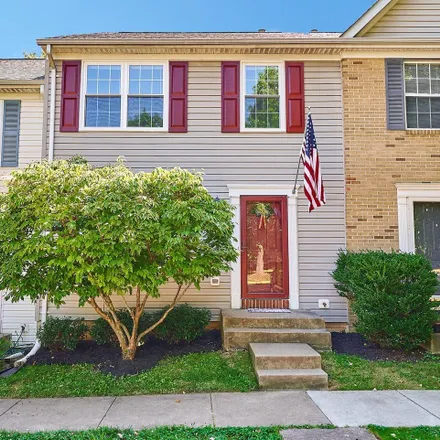
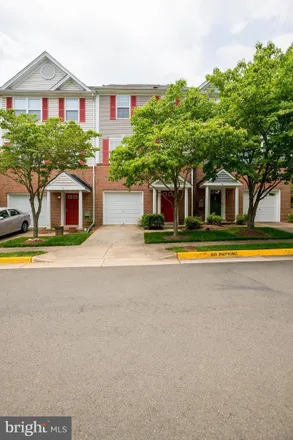
This beautiful 3 level townhome is conveniently located in the heart of Warrenton, with an abundance of amenities, shopping, restaurants, breweries and wineries located nearby. This home has 3 spacious bedrooms 2 full baths, two half baths and over2,...
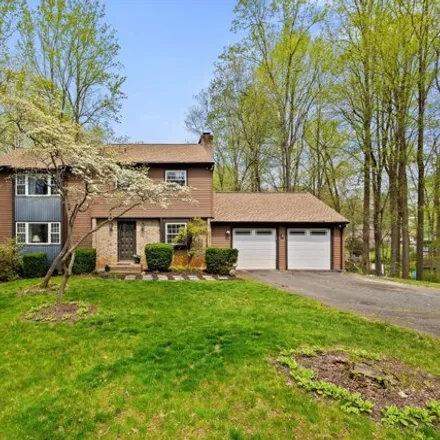
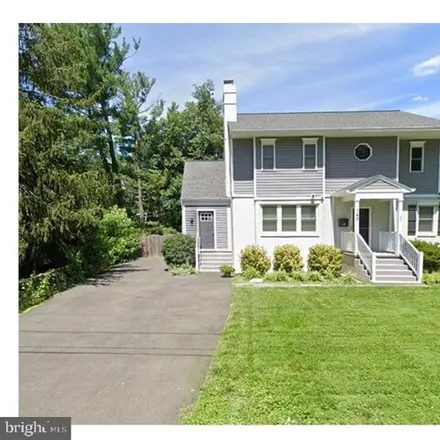
$595,000
$595,000
Available: Right Now
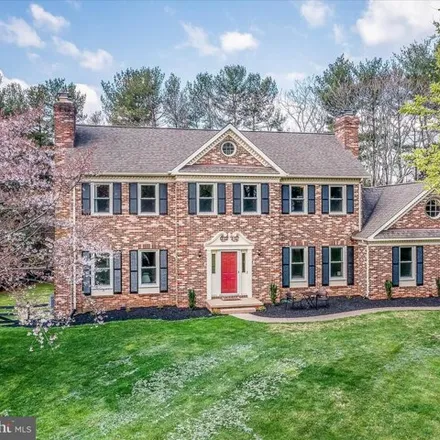
Spacious colonial in popular Warrenton Lakes on a large wooded cul de sac lot.. Home features updated kitchen with granite countertops and new stainless steel appliances. The main level includes living room, dining room and family room all with hardw...
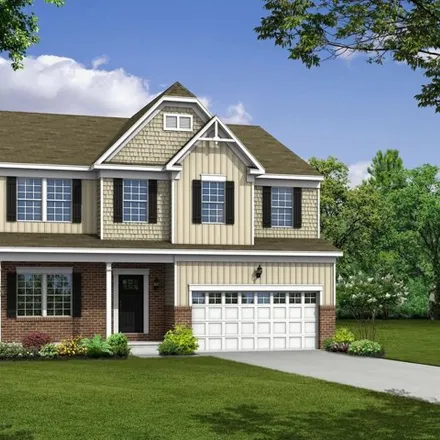
$699,990
$699,990
Available: Right Now
Finished Rec Room Included, plus $10k in Flex Cash! Millfield is Warrenton's newest community of wooded homesites just minutes from downtown Warrenton. The Birmingham is an impressive two-story floor plan providing space and flexibility to complement...
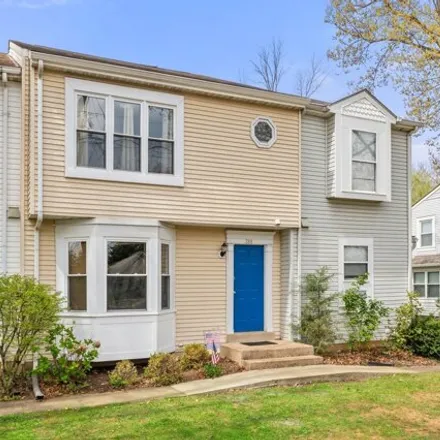
$369,900
$369,900
Available: Right Now
Affordable and attractive home in old town Warrenton!! This townhome is in good condition, and ready for your designer touches! The sunny kitchen has white painted cabinetry, plenty of counter space, stainless sink, slate counters, black appliances a...
$790,000
$790,000
Available: Right Now
Just what you have been waiting for..a lovely home in historic old towne warrenton. this 200 +/- Old charmer is waiting for a creative new owner that will love it and all of its charm. 3 bedrooms, 2 full baths, beautiful wide plank floors, ...

$299,000
$299,000
Available: Right Now
$619,000
$619,000
Available: Right Now
Recently remodeled and convenient to everything! Walk to shops, cafes, festivals, parades and more in charming Old Town Warrenton. Great yard nice and flat and big! 3/4 bedrooms depending on how many you need. 1/2 on main level (other room makes a gr...
$309,900
$309,900
Available: Right Now
$389,900
$389,900
Available: Right Now
$512,000
$512,000
Available: Right Now
One-of-a-kind home located across the street from The Warrenton United Methodist Church. This home sits on 1 acre in town with a large back yard, great for entertaining or for a garden. Less than 5 minutes to Fauquier Hospital, many grocery stores, a...
$1,3M
$1,3M
Available: Right Now
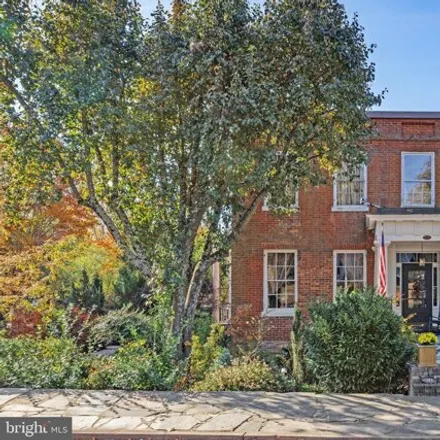
Ideally sited in the heart of the Warrenton Historic District, this extraordinary historic residence (circa 1840) is a masterpiece of Old Town significance. Originally identified as the William H. Jennings Home by the Architectural Review Board, Hear...
$749,900
$749,900
Available: Right Now
ONLY 2 Owners... Be the 3rd! Exceptional and Rare Gold Cup Estate Home! Centrally and vitally located in the heart of town, walking distance to key amenities, resources, and services. Highly desirable well-established Olde Gold Cup neighborhood with ...
$385,000
$385,000
Available: Right Now
$759,900
$759,900
Available: Right Now
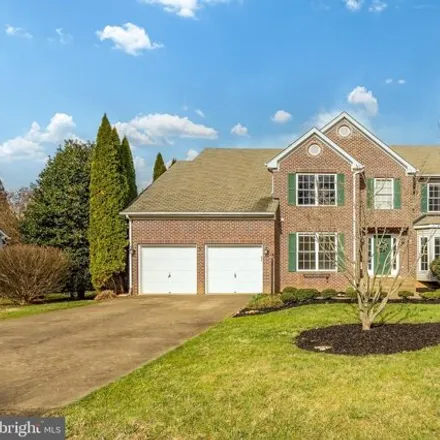
Nestled in the heart of Warrenton... Step inside to discover a meticulously maintained interior with countless upgrades and renovations. The home sits graciously on 1.23 ac. The recent enhancements include new windows that flood the home with natural...
$359,000
$359,000
Available: Right Now
$1,3M
$1,3M
Available: Right Now
Welcome to new private community with all custom homes located in the heart of historic Old Town Warrenton. Situated on a spacious 1/4 to 1/2 acre lot on a private street, this property offers a tranquil oasis with ornamental trees. Builder has vario...
$714,900
$714,900
Available: Right Now
$665,000
$665,000
Available: Right Now
Warrenton
According to statistics, the population in Warrenton, VA amounts to 9,854, which shows decline 0% compared to the previous year. The median age of the city’s residents is 39. The average household income is $70,863, shifting growth 5% from the past year, and the average property value in Warrenton, VA decline -3% to $312,400 throughout the year.
| Population | 9,854 |
| Median Age | 39.4 |
| Poverty Rate | 6% |
| Household Income | $70,863 |
| Number Of Employees | 4,925 |
| Median Property Value | $312,400 |
Household Income
The average household income in Warrenton, VA grew from $67,553 to $70,863 in the past year. This data is an estimate based upon 3,771 households in Warrenton, VA . The chart below presents how household income is distributed in Warrenton, VA in comparison to the revenue allocation amid households nationally.
Property Value
According to data from last year, the average property value in Warrenton, VA shifted from $320,900 to $312,400 throughout the year. The subsequent graph indicates the share of properties in the given price range in Warrenton, VA in comparison to the median property value in the same price segment across the country. According to the data, the greatest share of Warrenton, VA properties falls in the '$300,000 to $399,999' range, which is higher than the most significant median property across the country.
Rent vs. Own
Property Taxes
One of the most important aspects for property owners is the amount of property taxes. This graph shows distribution of property taxes in Warrenton, VA compared to median property taxes around the country. The prevalent amount of property taxes in Warrenton, VA equals $3000, which is less than the national average.