West Richland, WA, USA apartments for sale
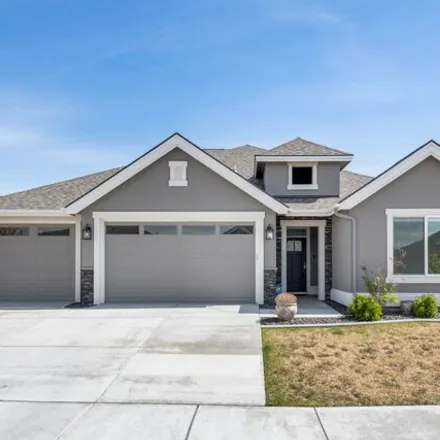
$975,000
$975,000
Available: Right Now
Experience the Ultimate in Luxury Living Nothing Short of Spectacular! Revel in the breathtaking scenic views and prime location, enhanced by elegant designer finishes and masterful craftsmanship, brought to you by Peake Homes! Abundant square footag...
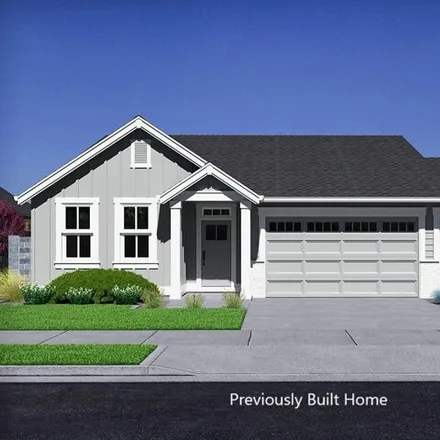
$559,900
$559,900
Available: Right Now
MLS# 274454 Quail Ridge at Horn Rapids is a new premier Pahlisch Homes community that will feature a resort-style amenities such as pool, clubhouse and gym. The Carrington is a stunning rambler by Pahlisch Homes offering 3 bedrooms, 3 bathrooms, 3-ca...
$479,000
$479,000
Available: Right Now
Welcome to this stunning brand-new home by Tropical Dew! Situated in a quiet cul-de-sac within the desirable West Richland neighborhood, this spacious rambler offers an impressive1, 923sqft of living space. Step inside and be greeted by a thoughtfull...
$600,000
$600,000
Available: Right Now
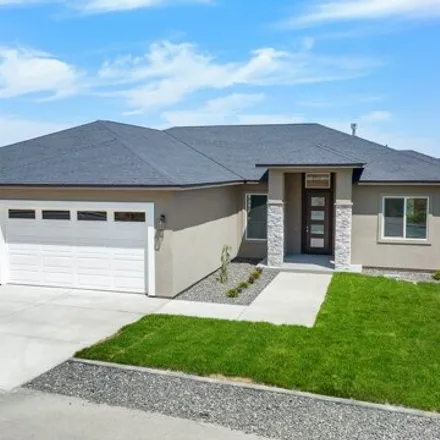
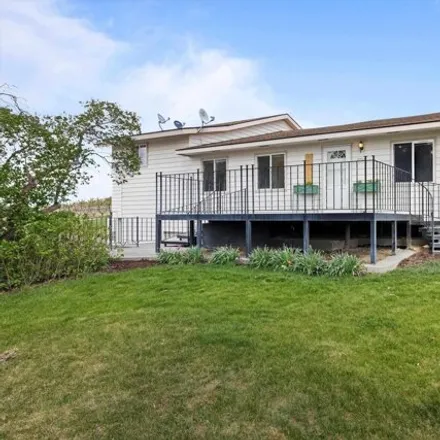
Distinctive, one of a kind, custom home with soaring ceilings, walls of windows and large rooms full of light. Highly remodeled and renovated with tile and laminated floors, new cabinets, quartz and granite countertops, newer roof, updated bathrooms,...
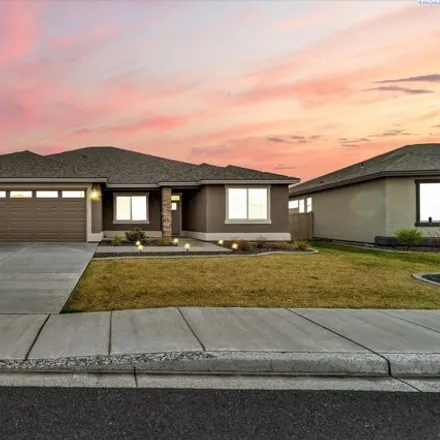
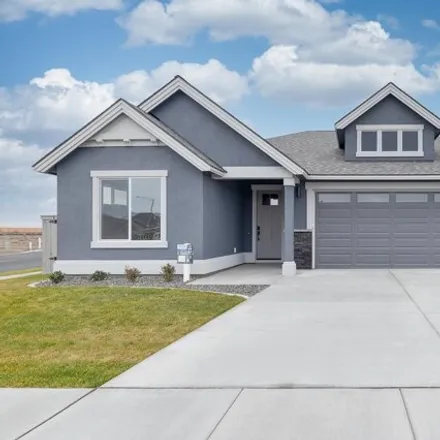
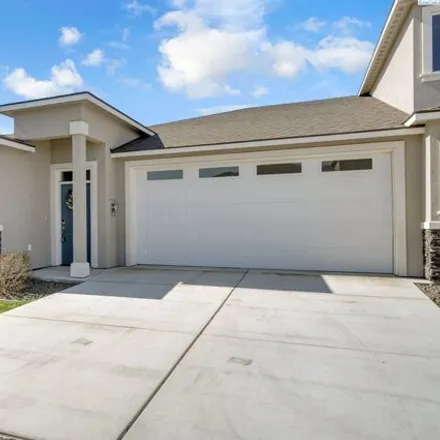
$619,900
$619,900
Available: Right Now
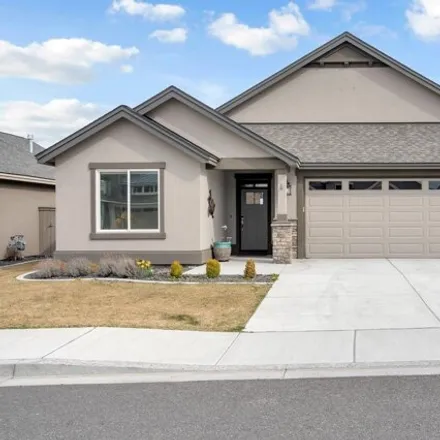
Welcome home to this stunning luxury home nestled in the heart of the desirable neighborhood of Horn Rapids. This property promises a lifestyle of comfort and convenience. Boasting 3 spacious bedrooms and 3 Baths, this home offers an inviting atmosph...
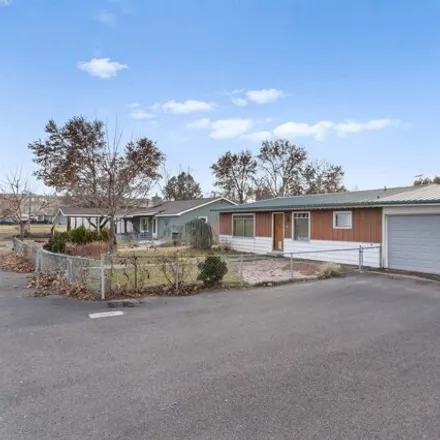
$325,000
$325,000
Available: Right Now
Exciting Potential! Explore the possibilities of this 4-bedroom, 2-bath home nestled in an established West Richland neighborhood. SoldAS IS,this property sits on a spacious quarter-acre lot, offering ample space for multi-generational living or crea...
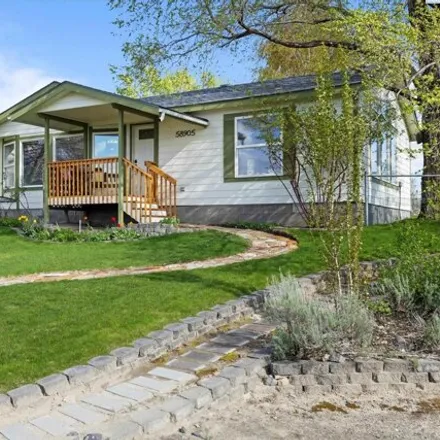
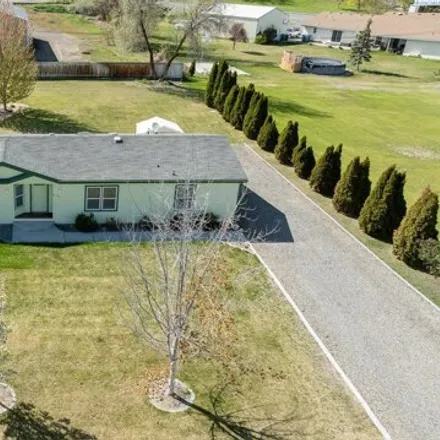
$459,900
$459,900
Available: Right Now
MLS# 275124 Welcome to your dream home nestled on 5 picturesque acres with breathtaking views of Rattlesnake Mountain and Red Mountain! This charming 3 bed, 2 bath residence boasts 1836 sq feet of comfortable living space, offering a serene retreat f...
$679,900
$679,900
Available: Right Now
MLS# 274745 This Pahlisch-built residence in Horn Rapids is better than new with an array of upgrades. Upon entry, youre greeted with ample natural light, a room that can easily serve as a bedroom or office, and soaring ceilings leading to the spacio...
$649,000
$649,000
Available: Right Now
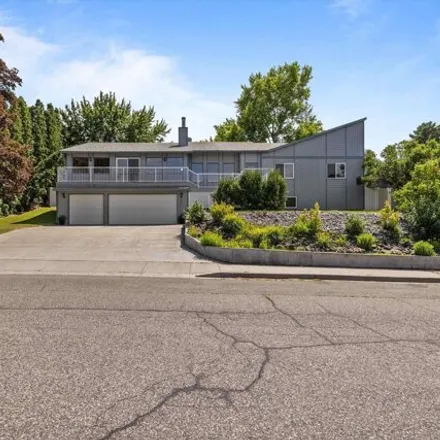
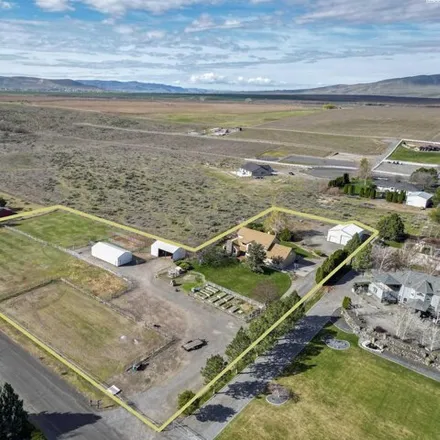
MLS# 275102 Beautiful Acreage, with great views of the Yakima River and Rattlesnake Mountain! This 5 acre parcel is the dream get away from the fast paced life, with so much to offer and peaceful setting! Nestled on this property is a updated large T...
$459,900
$459,900
Available: Right Now
Nestled on the 16th hole of Horn Rapids Gold Course community this 3 bed, 2 bath home is ready for new owners. Clean and bright with a large primary suite that has a separate sitting area and sliding glass door to the back patio. The kitchen has new ...
$584,900
$584,900
Available: Right Now
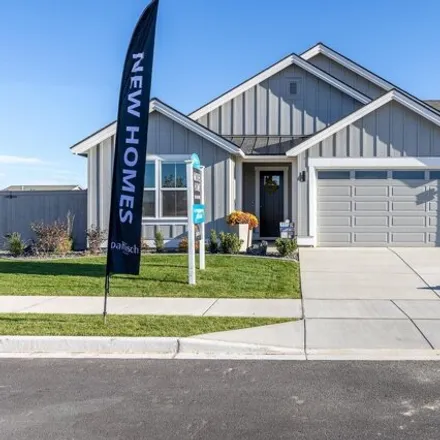
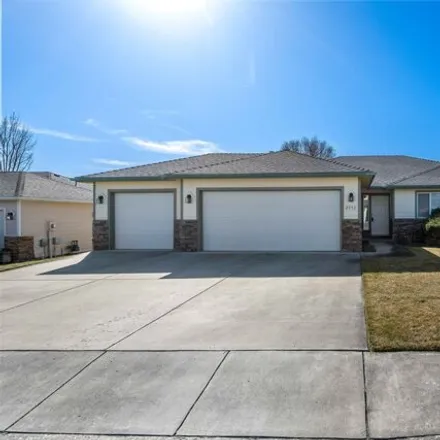
This charming single-family suburban style house is nestled in the heart of Horn Rapids - a vibrant community that boasts a pool and clubhouse. Plus, golf enthusiasts will relish being near the renowned Horn Rapids Golf Course! This delightful proper...
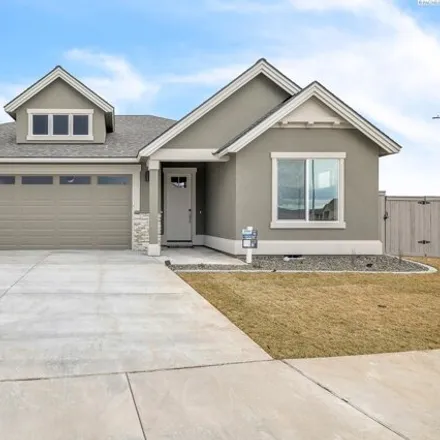
$584,900
$584,900
Available: Right Now
MLS# 274757 Stunning Split Bedroom Stucco Rambler with 3 BRs, 2 Baths + an office. Home features vaulted ceilings, gorgeous hardwood floors, large great room with custom built-ins and gas fireplace! Kitchen has ample cabinetry with granite counters, ...
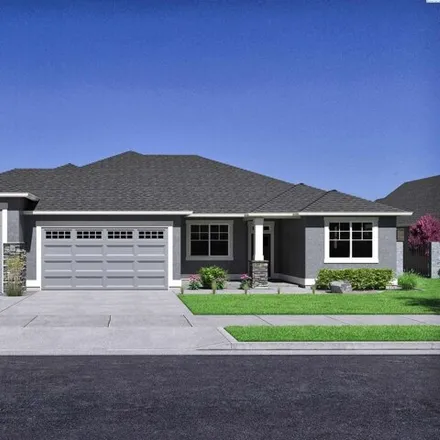
$539,900
$539,900
Available: Right Now
MLS#271499 Quail Ridge at Horn Rapids is a new premier Pahlisch Homes community that will feature a resort-style amenities such as pool, clubhouse and gym. The Chase offers floor to ceiling hand textured wall details and mill work finished to perfect...
$534,900
$534,900
Available: Right Now
MLS# 270703 30k price reduction ! New Photos! Quail Ridge at Horn Rapids is a new premier Pahlisch Homes community that will feature a resort-style amenities such as pool, clubhouse and gym. The Chase offers floor to ceiling hand textured wall...
$619,900
$619,900
Available: Right Now
Horn Rapids Golf Coarse Frontage!!! A panoramic View of the Golf Course in this Pahlisch Built home!! Tall Entry, and Grand Great Room, makes this custom home feel Huge!! Light and bright living areas with large windows gives clarity to sight!! Funct...
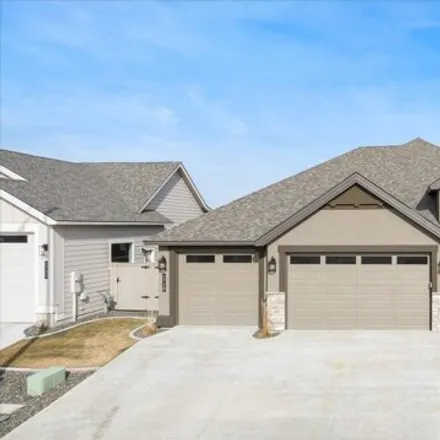
$650,000
$650,000
Available: Right Now
MLS# 274711 Live your best life in West Richland! With three bedrooms, AND a den/office, two full baths, a three-car garage, PLUS an extraordinary 14 x 32 shop - you can move right in and love your life! Lovely finishes are found throughout this well...
$465,000
$465,000
Available: Right Now
MLS# 274452 Luxurious 3-bedroom, 1.75-bath stucco townhome complete with upgrades all around! Quartz countertops, custom-painted cabinetry, and vinyl plank flooring radiate elegance from the moment you enter. This property is move-in ready with a pri...
$320,000
$320,000
Available: Right Now
MLS# 275086 Welcome to your oasis in West Richland! This lovely property and home offers everything you've been searching for: space, comfort and tranquility, all nestled on a charming.44 acre lot in a serene neighborhood. Boasting 3 bedrooms, 2 bath...
$509,900
$509,900
Available: Right Now
MLS#274470 Quail Ridge at Horn Rapids is a new premier Pahlisch Homes community that will feature a resort-style amenities such as pool, clubhouse and gym. The Chapman by Pahlisch Homes is a modern, yet warm and inviting floor plan our clients LOVE t...
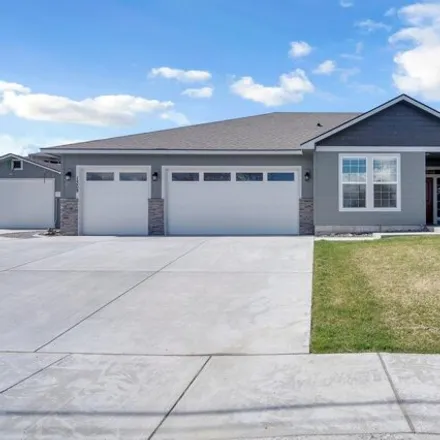
$619,900
$619,900
Available: Right Now
MLS# Quail Ridge is a premier Pahlisch Homes community in Horn Rapids. The Malone features, 2, 411sq ft. of picturesque living space. Spacious great room design with soaring ceilings and expansive windows. This space is truly ideal for family gatheri...
$825,000
$825,000
Available: Right Now
MLS# 274650 Welcome to this breathtaking horse property located on a sprawling 3.19 acres spanning across 2 tax parcels in beautiful West Richland. This custom-built home is anything but ordinary, boasting unique design elements and impeccable crafts...
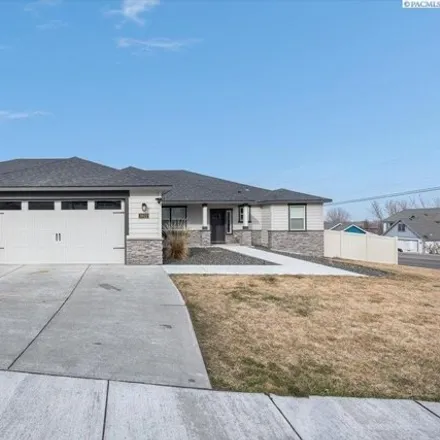
$637,999
$637,999
Available: Right Now
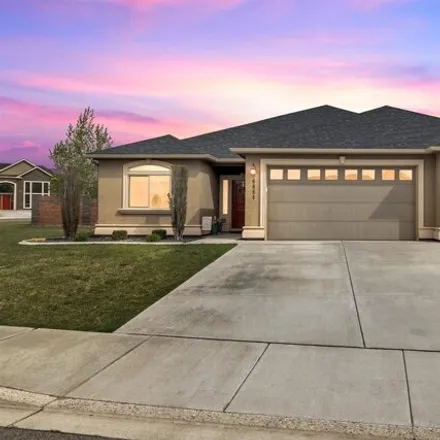
Indulge in the epitome of modern luxury with this exceptional 5-bedroom, 3-bathroom Hayden Homes sanctuary, artfully constructed in 2022. Resting upon a sprawling 0.43-acre lot, this residence is a testament to refined living and architectural excell...
West Richland
According to statistics, the population in West Richland, WA amounts to 13,797, which shows growth 3% compared to the previous year. The median age of the city’s residents is 36. The average household income is $86,686, shifting growth 3% from the past year, and the average property value in West Richland, WA growth 8% to $217,700 throughout the year.
| Population | 13,797 |
| Median Age | 36 |
| Poverty Rate | 10% |
| Household Income | $86,686 |
| Number Of Employees | 6,378 |
| Median Property Value | $217,700 |
Household Income
The average household income in West Richland, WA grew from $84,419 to $86,686 in the past year. This data is an estimate based upon 4,687 households in West Richland, WA . The chart below presents how household income is distributed in West Richland, WA in comparison to the revenue allocation amid households nationally.
Property Value
According to data from last year, the average property value in West Richland, WA shifted from $202,200 to $217,700 throughout the year. The subsequent graph indicates the share of properties in the given price range in West Richland, WA in comparison to the median property value in the same price segment across the country. According to the data, the greatest share of West Richland, WA properties falls in the '$300,000 to $399,999' range, which is higher than the most significant median property across the country.
Rent vs. Own
Property Taxes
One of the most important aspects for property owners is the amount of property taxes. This graph shows distribution of property taxes in West Richland, WA compared to median property taxes around the country. The prevalent amount of property taxes in West Richland, WA equals $2500, which is less than the national average.