Albion, IL 62806, USA apartments for sale

$89,900
$89,900
Available: Right Now
New listing !!! 360 S. Second St., Albion Here's an attractive, efficient, and well-situated home with proximity to Champion Labs and Route 130 on Albion's South side. With two-to-three-bedrooms, one full bath, additional half bath, and too ma...
$85,000
$85,000
Available: Right Now
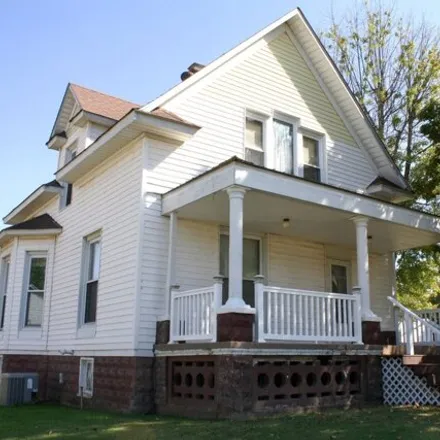
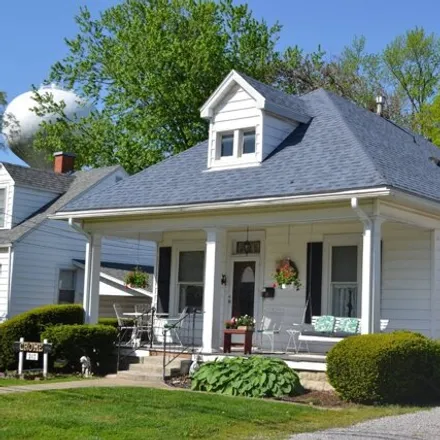
New listing !!! 50 S. Second St., Albion This stately residence, built in 1918, has tons of character and charm with much of its original hardwoods, molding, trim, and doors intact. Situated on a handsome corner lot on Albion's East side, the ...
$429,000
$429,000
Available: Right Now
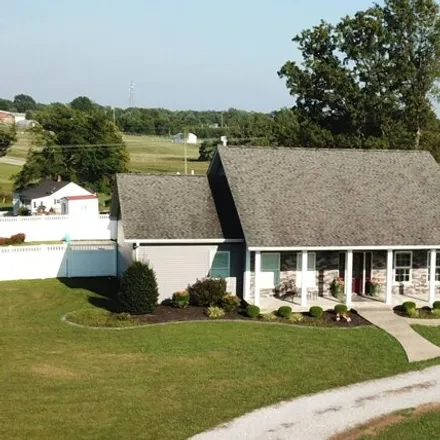
98 Flower Dr., Albion This immaculate, 2, 882square-foot home, custom built in 2016, has everything you're looking for! It's situated on 1.71 acres in the Wanboro Lake Subdivision with 18'x32' in-ground pool, partially fenced back yard for privacy wh...

$85,000
$85,000
Available: Right Now
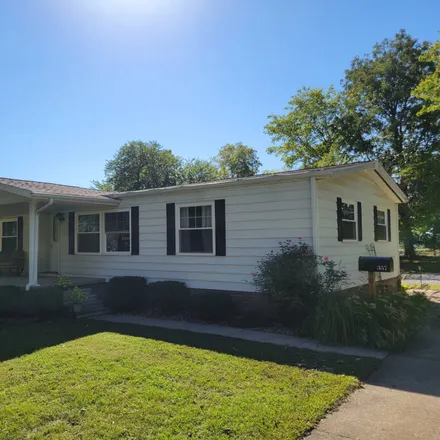
Welcome to this delightful 2-bedroom, 1-bathroom gem, thoughtfully refurbished and ready to enchant homeowners seeking comfort and character! Enjoy morning coffee on either of the enclosed porches, or enjoy a peaceful place to relax at the end of the...
$89,000
$89,000
Available: Right Now
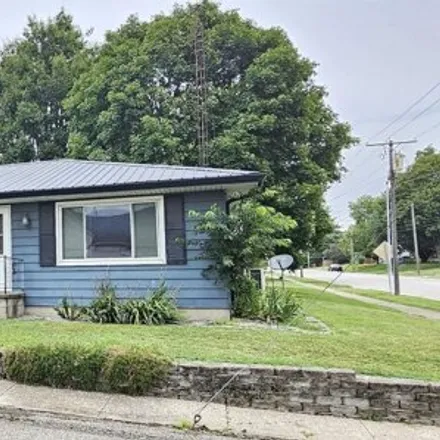
Here's an exceptionally well-maintained manufactured home situated on a beautiful, oversized lot in Albion! With approximately1, 440square feet of living area, three bedrooms, two full bathrooms, front and back porches, and detached carport, this tas...

$159,900
$159,900
Available: Right Now
New listing !!! 45 S. Eighth St., Albion Here's a beautiful home with approximately2, 550square feet of gross living area, partial, unfinished basement, and attached garage situated in a picturesque residential neighborhood on Albion's West si...
$89,900
$89,900
Available: Right Now
Beautiful well built home with amazing space on the inside! You will be amazed by the room sizes in this home. Updates include Champion vinyl windows throughout as well as a new Champion sliding door in the sunroom space. Newly installed mini-splits ...
$99,900
$99,900
Available: Right Now
New listing !!! 217 N. Fifth St., Albion This attractive residence, originally built in 1892, has plenty of character and charm with a large, covered front porch and much of its original molding, trim, and doors intact. Situated just north of ...
Albion
According to statistics, the population in Albion, IL amounts to 2,208, which shows n/a% compared to the previous year. The median age of the city’s residents is 40. The average household income is $39,471, shifting n/a% from the past year, and the average property value in Albion, IL n/a% to $67,500 throughout the year.
What is the Average Price of Apartments for Sale in Albion, IL, 62806?
| Month | Median Price |
|---|---|
| Jun 2024 |
$294,781
|
| May 2024 |
$226,939
|
| Apr 2024 |
$170,706
|
| Mar 2024 |
$170,706
|
| Feb 2024 |
$170,706
|
| Jan 2024 |
$170,706
|
Household Income
The average household income in Albion, IL grew from $n/a to $39,471 in the past year. This data is an estimate based upon n/a households in Albion, IL . The chart below presents how household income is distributed in Albion, IL in comparison to the revenue allocation amid households nationally.
Property Value
According to data from last year, the average property value in Albion, IL shifted from $n/a to $67,500 throughout the year. The subsequent graph indicates the share of properties in the given price range in Albion, IL in comparison to the median property value in the same price segment across the country. According to the data, the greatest share of Albion, IL properties falls in the '$60,000 to $69,999' range, which is lower than the most significant median property across the country.
Property Taxes
One of the most important aspects for property owners is the amount of property taxes. This graph shows distribution of property taxes in Albion, IL compared to median property taxes around the country. The prevalent amount of property taxes in Albion, IL equals $1150, which is less than the national average.