Miami, FL, USA apartments for sale

$2,29M
$2,29M
Available: Right Now
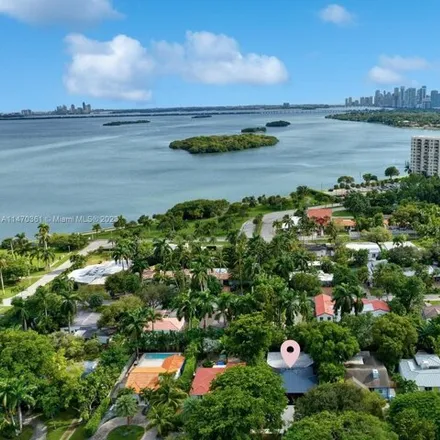
Location, Location, Location. Waterview. Direct unobstructed views of Biscayne Bay, from your screened in Florida Room. Classic all updated perfect 1950's MiMo home. Pool, Impact windows and doors, vaulted ceiling, new ac, new kitchen, and bathrooms....
$1,28M
$1,28M
Available: Right Now
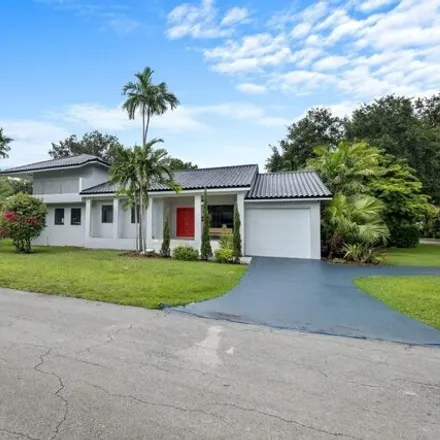
Completely updated 4/3 in beautiful Miami Springs. New impact windows and doors. Tongue and groove in living room vaulted ceilings. LED high hats throughout. Stunning new kitchen with top of the line appliances, Quartz waterfall island. Skylights in ...
$179,000
$179,000
Available: Right Now
Great Investment oportunity. You can rent from day one. Condo 1/1 on the second floor. Entire condo was renovated a few years ago. Open Kitchen with stainless steel appliances which include a microwave, refrigerator and stove. Tile floors. Master Bed...
$2,25M
$2,25M
Available: Right Now
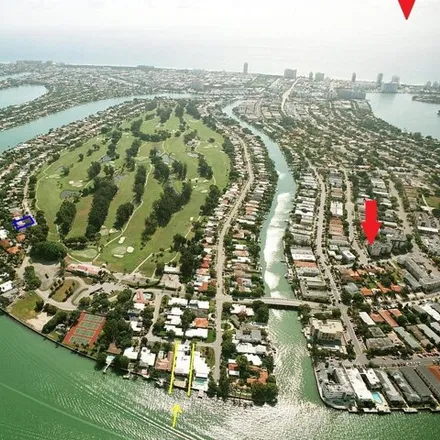
Double lot ! Centrally located in guard-gated Belle Meade, a trendy Upper East Side neighborhood! This 3, 241sqft home with4 BD/4 BA + office, and a1 BD/1 BAGuest House w/living room and secondary kitchen sits on an oversized15, 930 SFlot. Hug...
$2,22M
$2,22M
Available: Right Now
Welcome to Loft 920. This one-story fully renovated masterpiece situated in the exclusive gated community of Belle Meade is the perfect embodiment of modernism. Featuring sleek interiors, the natural materials of the dark steel exposed beams, the con...
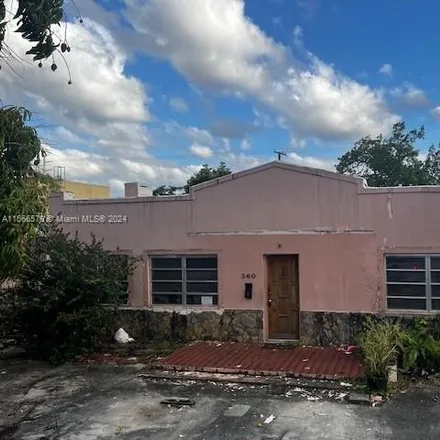
$375,000
$375,000
Available: Right Now
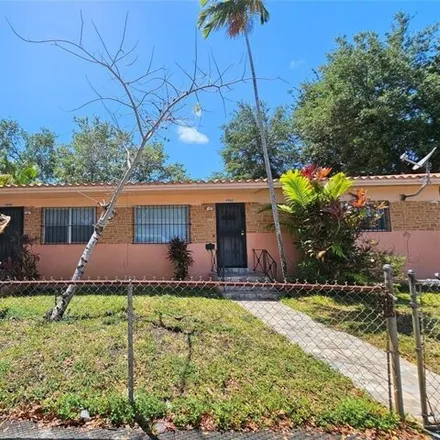
This single-family residence boasts 4 bedrooms, 2 bathrooms, and other desirable amenities. As you step into this home, you'll be greeted by a spacious living area with natural light. The master suite is complete with a private en-suite bathroom for ...
$1,55M
$1,55M
Available: Right Now
One of a kind 2 story direct bay front condominium residence in sought after Cielo on the Bay. Completely remodeled featuring an extravagant and beautifully designed European kitchen with top of the line Jennair appliances, exquisite porcelain floors...
$2,89M
$2,89M
Available: Right Now
Great opportunity to aquire in an excellent area 12 unit in 2 buildings off biscayne blvd and 75th ave. buildings each containing 12 large one bedroom units with tile floors, kitchens, baths and large closets !!! You can bay one prop...
$1,75M
$1,75M
Available: Right Now
Breathtaking water view1, 910Sq.Ft unit featuring 3Bd x 3Ba (2 suites), incredible spacious designed room layouts and balconies, decoration and design signed by well known Brazilian Architect Nayara Macedo, located at the extraordinary Cielo on the B...
$1,05M
$1,05M
Available: Right Now
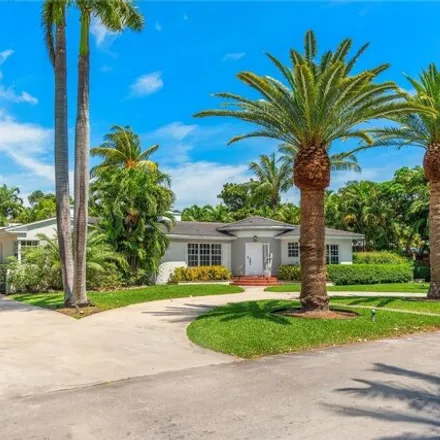
An exceptional residence located in the highly sought-after Belle Meade gated community. Situated on a corner lot, this home welcomes you with a tastefully designed living room featuring exposed beams, hardwood floors, and a historic fireplace that a...

$3,5M
$3,5M
Available: Right Now
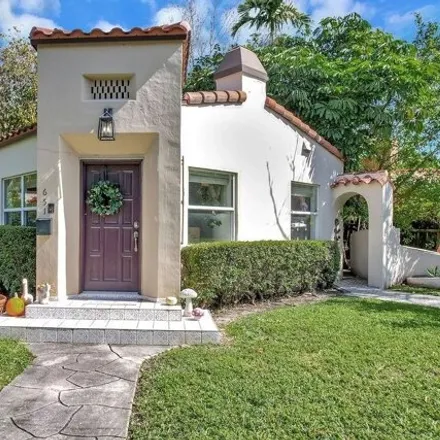
Stunning Morningside Historic District Old Spanish / Mediterranean Beauty! Immaculate 4/3.5 completely remodeled. Main House 3/2.5 with 2 a/c units featuring spacious master bedroom with sitting area and balcony, spacious living room, dining room, me...
$995,000
$995,000
Available: Right Now
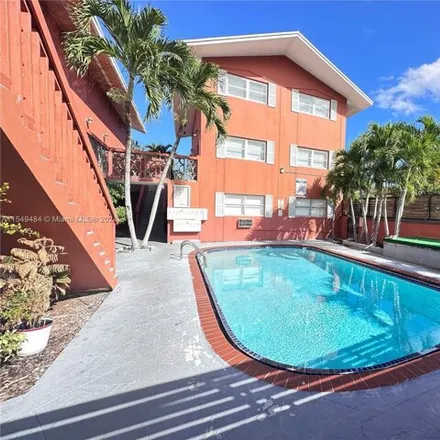
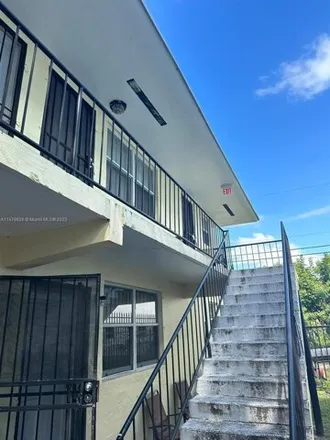
This beautifully maintained two-story multi-family property offers a fantastic investment opportunity. With spacious 2-bedroom units, no violations/liensm and a brand-new roof installed with proper permits, it's a hassle-free investment. Tenants will...
$1,45M
$1,45M
Available: Right Now
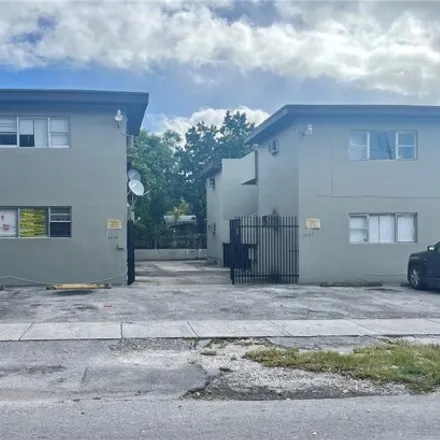
Great opportunity to aquire in an excellent area 6 unit building off biscayne blvd and 75th ave. buildings each containing 6 large one bedroom units with tile floors, kitchens, baths and large closets !!! You can bay one property or ...
$265,000
$265,000
Available: Right Now
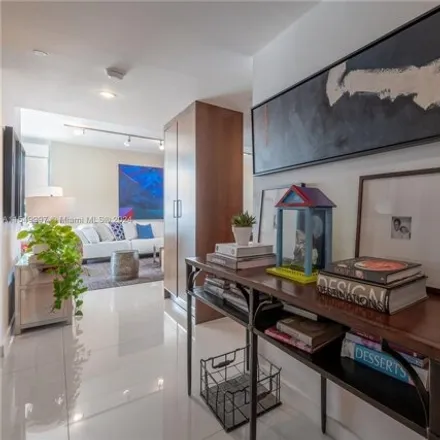
Miami Beach Great 1 bedroom / 1.5 bath a few blocks from the beach, with 1 assigned covered parking, a rare find. Second floor unit overlooks the neighborhood's surrounding with lots of trees and private homes. This boutique 5 story corner building i...
$820,000
$820,000
Available: Right Now
Great investment opportunity in booming Innovation District zoning T3-O.Legal duplex 2/2 + 1/1 with washer/dryer for each unit, 2 separate water meters , 2 electric meters and central A/C. Large sideyard, 2 parking spots. The property is located in a...
$657,000
$657,000
Available: Right Now
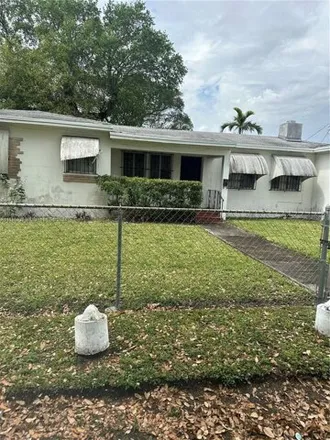
Beautifully updated home with all modern features. New Roof. New kitchen cabinets with granite countertops. Modern bathrooms with new cabinets and bathroom fixtures. High hat lighting in every room of the house. New tile and floorboards throughout. I...

$625,000
$625,000
Available: Right Now
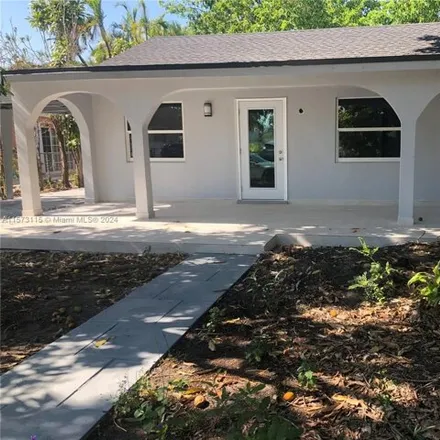
Explore this meticulously remodeled 4-bed, 2-bath treasure in Miami, offering 2162 sqft of modern living on a sprawling15, 682sqft lot. Upgrades include new wiring, roof, impact windows and doors, fresh paint, and chic tiles throughout. Dream big wit...
$799,900
$799,900
Available: Right Now
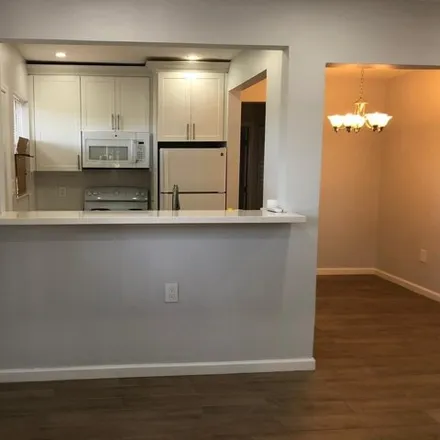
Investor dream come true. Amazing home and lot in an opportunity zone area. This home and lot are currently zone as multi-family with 2 up to 9 units that could be built on this lot. The new owner could legally build up to three stories high and coul...
$725,000
$725,000
Available: Right Now
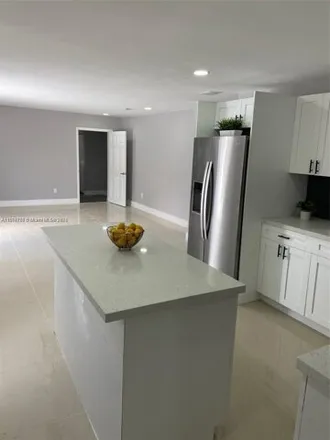
Stunning completely renovated single family house with over 7000 sqft lot size. This corner house boasts LED lights, new appliances, quartz countertops, ceramic floors, and he laundry. New Roof and Central AC system. Nestled in a quiet neighborhood, ...
$499,000
$499,000
Available: Right Now
Investors - looking for a cash flow opportunity ! Roof replaced in 2020. The duplex features two distinct units, offering versatility and income potential. The first unit comprises of a 1 bedroom, 1 bath, currently leased on a month-to-...
$586,000
$586,000
Available: Right Now
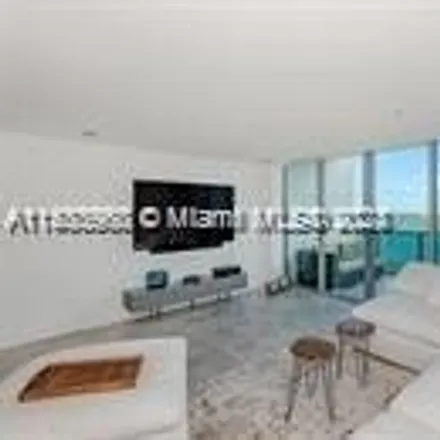
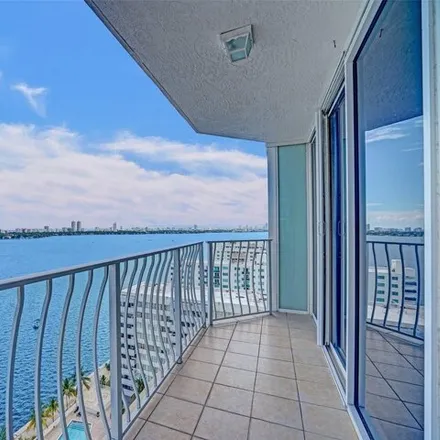
Stunning unobstructed South East high floor corner unit with stunning views of the Ocean and Biscayne Bay! This 2 bedroom 2 bathroom is one of the biggest and most spacious units in the building with breathtaking unobstructed water views from all aro...
$415,000
$415,000
Available: Right Now
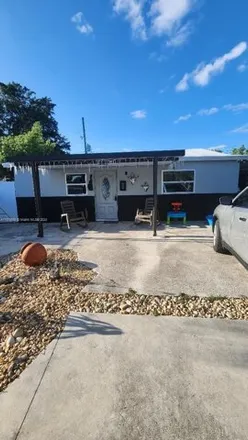
Cozy corner 2 Bedroom 1 Bathroom House centrally located in the heart of the northwest district. Tastefully remodeled including an upgraded kitchen and large bedrooms. Nice spacious driveway to accommodate all of your vehicles. Great opportunity for ...
Miami
According to statistics, the population in Miami, FL amounts to 470,911, which shows growth 2% compared to the previous year. The median age of the city’s residents is 41. The average household income is $41,818, shifting growth 4% from the past year, and the average property value in Miami, FL growth 9% to $350,400 throughout the year.
| Population | 470,911 |
| Median Age | 40.5 |
| Poverty Rate | 26% |
| Household Income | $41,818 |
| Number Of Employees | 235,956 |
| Median Property Value | $350,400 |
What is the Average Price of Apartments for Sale in Miami, FL?
| Month | Median Price |
|---|---|
| Apr 2024 |
$359,844
|
| Mar 2024 |
$359,844
|
| Feb 2024 |
$595,390
|
| Jan 2024 |
$595,390
|
| Dec 2023 |
$211,125
|
| Nov 2023 |
$468,325
|
| Month | Median Price |
|---|---|
| Apr 2024 |
$755,007
|
| Mar 2024 |
$755,007
|
| Feb 2024 |
$755,007
|
| Jan 2024 |
$755,007
|
| Dec 2023 |
$834,832
|
| Nov 2023 |
$576,459
|
Household Income
The average household income in Miami, FL grew from $40,327 to $41,818 in the past year. This data is an estimate based upon 182,631 households in Miami, FL . The chart below presents how household income is distributed in Miami, FL in comparison to the revenue allocation amid households nationally.
Property Value
According to data from last year, the average property value in Miami, FL shifted from $322,100 to $350,400 throughout the year. The subsequent graph indicates the share of properties in the given price range in Miami, FL in comparison to the median property value in the same price segment across the country. According to the data, the greatest share of Miami, FL properties falls in the '$300,000 to $399,999' range, which is higher than the most significant median property across the country.
Rent vs. Own
Property Taxes
One of the most important aspects for property owners is the amount of property taxes. This graph shows distribution of property taxes in Miami, FL compared to median property taxes around the country. The prevalent amount of property taxes in Miami, FL equals $3000, which is less than the national average.