Anderson, CA 96007, USA apartments for sale
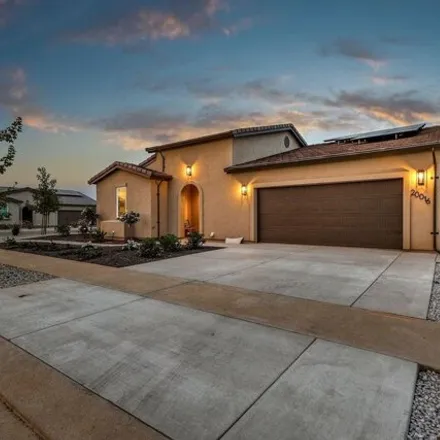
$524,900
$524,900
Available: Right Now
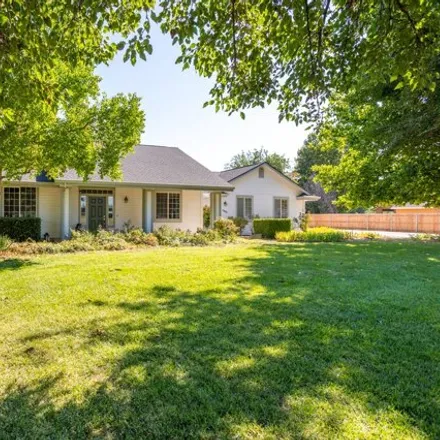
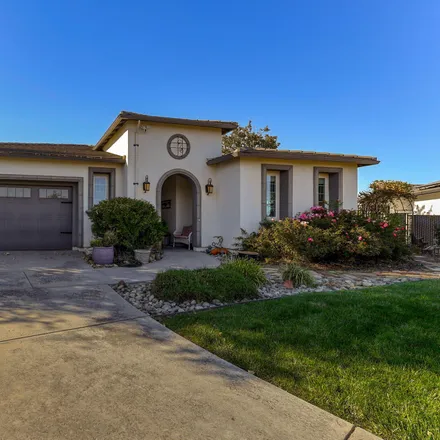
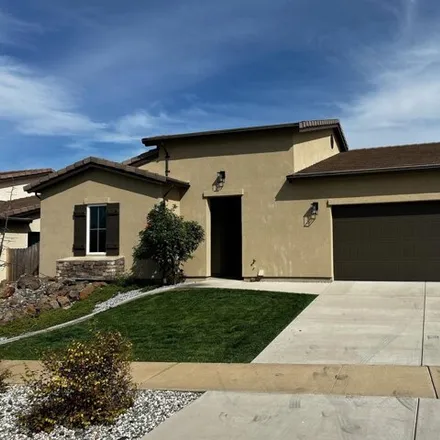
Brand new home w HUGE landscaped backyard w deck and gazebo ($20k+ upgrade)! Affordable luxury at Skyview Estates -amazing views await. Completed New Build in quiet culdesac! 3 bed/2 bath home w gorgeous architecture, high ceilings, arches, tile roof...
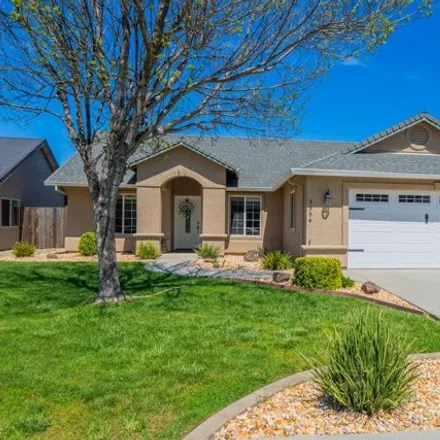
$499,900
$499,900
Available: Right Now
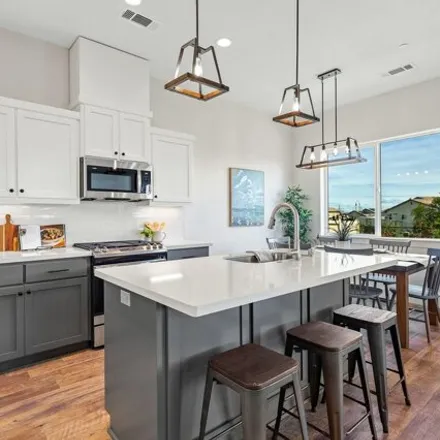
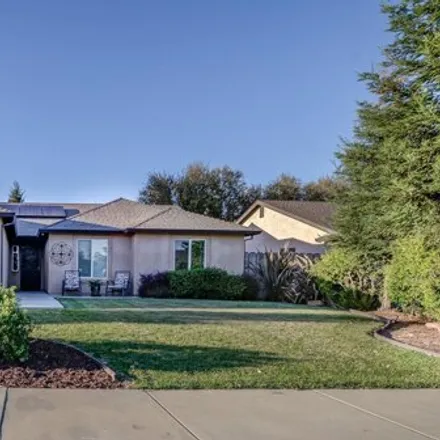
This beautiful home has it all. Great location, 3 bedrooms, double door office, 2 large bath rooms, split floor plan, all granite countertops, stainless steel appliances, cathedral ceilings, perfect size backyard beautiful layout privacy, but open. I...
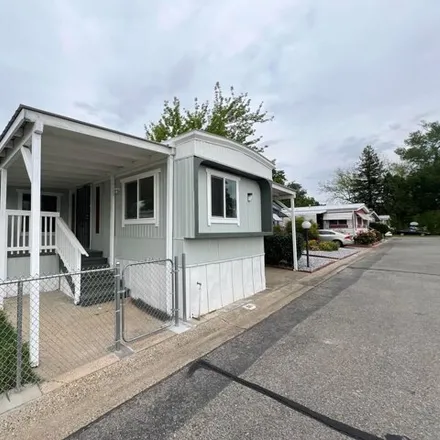
$110,000
$110,000
Available: Right Now
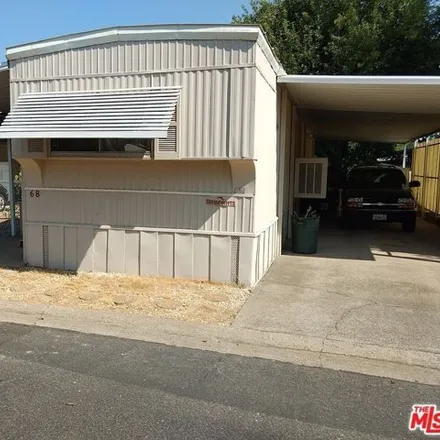
Fully remodeled ! New Roof and A/C Mini Splits! Enjoy your beautiful slice of freedom at 19964 Riverside Drive Sunny Anderson, CA. Nestled in the coveted El Rio Estates, a riverfront family park, this charming mobile home is a blend of comfort...
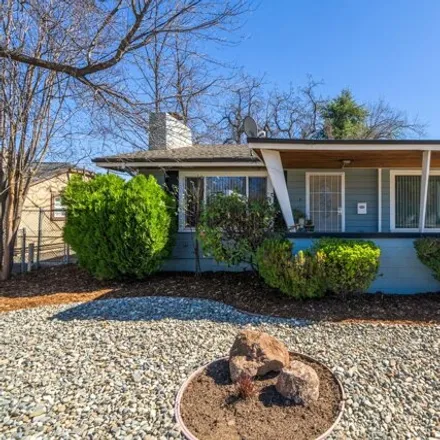
$275,000
$275,000
Available: Right Now
This charming 3-bed 2-bath home in Anderson boasts a level city lot and possibility of commercial use. A functioning wood fireplace in the living room. The kitchen offers ample counter space and cabinets, making it perfect for cooking enthusiasts. Wi...
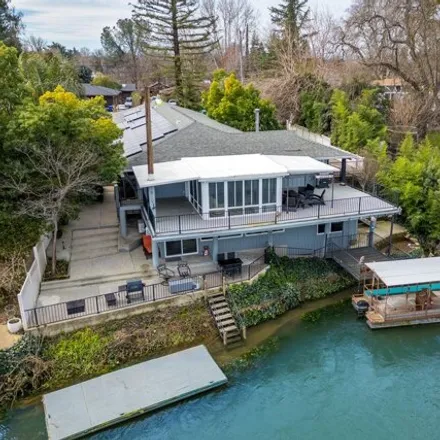
$899,000
$899,000
Available: Right Now
Sacramento Riverfront Home with breathtaking 180 degree river views! Step outside onto your private boat dock for world class fishing and enjoy Mt. Lassen views in the distance. Tesla solar system with backup battery pack to offset expenses. Property...
$284,500
$284,500
Available: Right Now
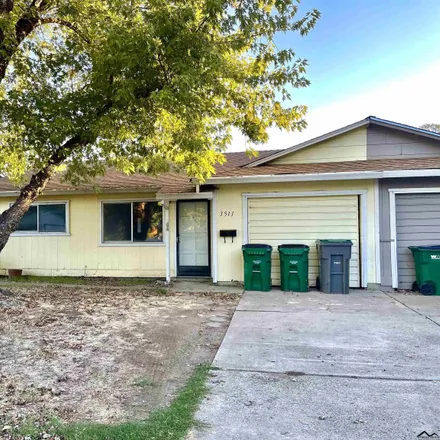
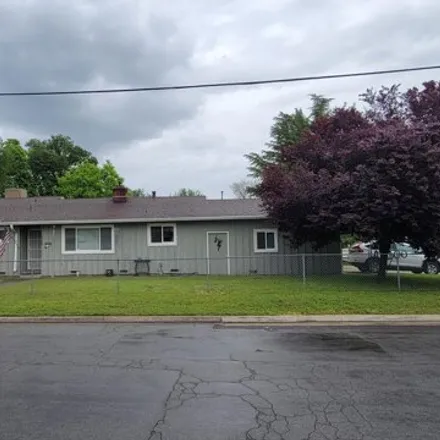
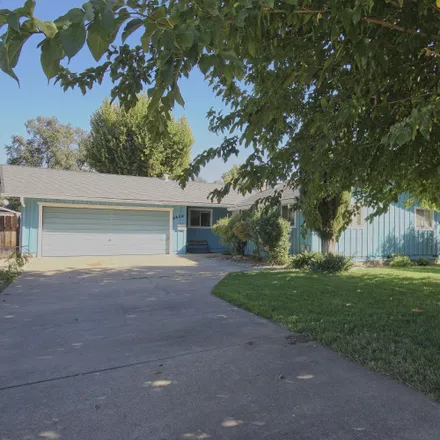
Cute home in a convenient location of Anderon. Homes has undergone a number of upgrades that include - New Roof, New Carpeting, New Air Conditioning Unit, Repaired duct work, Bathroom has new Shower Stall that was just installed, New Water Heater, an...
$925,000
$925,000
Available: Right Now
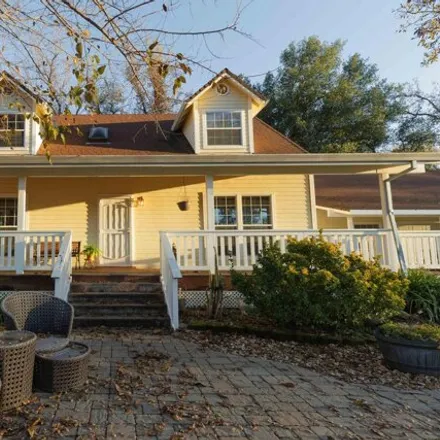
Beautiful custom country home close to town with creek frontage and a private feel. Sit on the covered, wrap-around porch and admire the views in every direction! This historic property was part of a large ranch at one time and features a dutch-style...
$359,900
$359,900
Available: Right Now
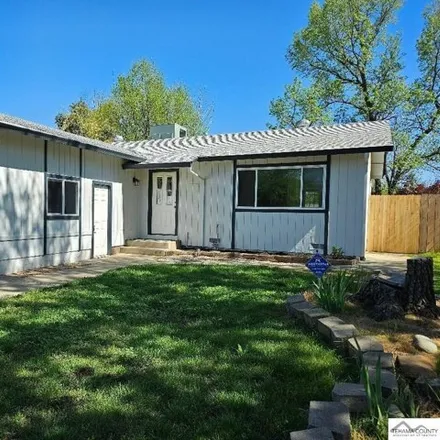
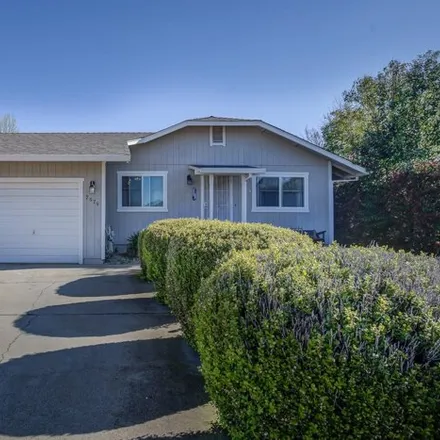
This is the perfect place to call home! Cute front yard with a picket fence and a fully fenced back yard. Step in to vaulted ceilings, wood laminate flooring, good sized kitchen with breakfast bar, good sized bedrooms and indoor laundry room. Built-i...
$675,000
$675,000
Available: Right Now
Horse property !! If you are in search of a property within Anderson City limits that is perfectly set up for your horse dreams look no further! Includes a 2 stall barn with water, lights, power, a paddock, round pen, feed and tack sheds. Fenc...
$539,900
$539,900
Available: Right Now
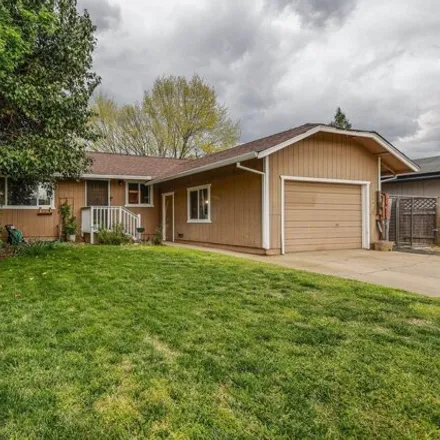
Affordable luxury at Skyview Estates - where amazing views await you. Beautiful wooded/greenbelt views in your backyard! 3 bed/2 bath home has gorgeous architecture, high ceilings, arches, tile roof and smooth exterior stucco. Kitchen and bathrooms h...
$219,000
$219,000
Available: Right Now
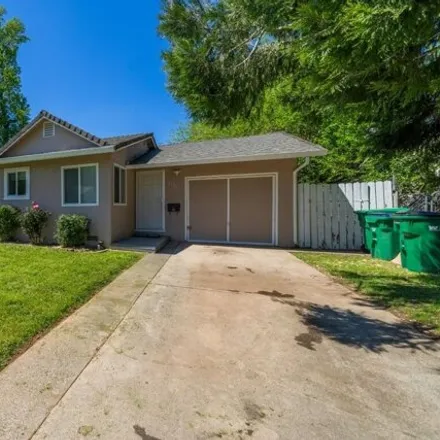
$267,000
$267,000
Available: Right Now
Welcome to 1471 2nd street. are you looking for an affordable turnkey home with a huge back yard ? Well you found it. this lovely gem has just been fully renovated. step inside and you will be pleasantly surprised at how beautiful and brigh...
$309,000
$309,000
Available: Right Now
Fantastic Anderson home with spacious living room and large kitchen and dinning area. Original hardwood flooring throughout most of the house. 3bd 2 ba and over 1500sq ft , nice back yard with coverd patio. Plenty of room to park Rv/boat. Newer windo...
$567,000
$567,000
Available: Right Now
$32,000
$32,000
Available: Right Now
Well maintained singlewide Mobile Home in Family M H Park(Must be approved first, pickup a packet at parks Office)Animals with park approvalPartly remodeledNewer floorsNewer fridgeWasher and dryer hookups Kitchen with lots of cabinets and a pantryNat...
$290,250
$290,250
Available: Right Now
Cute and Clean! Situated in a quiet neighborhood, this darling 3 bedroom 2 bathroom home has everything you could ever want and more. Once inside, you will immediately notice the beautiful laminate flooring, lightly painted walls, an abundance of nat...
$279,000
$279,000
Available: Right Now
Welcome to your future oasis, conveniently located near natural amenities and shopping! This charming 3-bedroom, 2-bathroom home offers a blank canvas for your imagination. Situated in a tranquil neighborhood, it welcomes you with a spacious layout a...
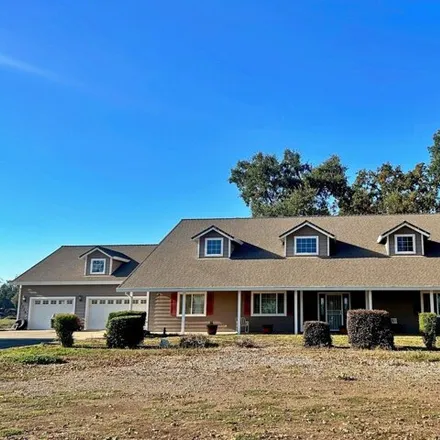
$474,950
$474,950
Available: Right Now
Delightful, Hidden Farm house tucked back at the end of a country lane yet close to everything. Great flow on the first floor complete with a first floor master. Second floor could be a kids delight. Very cool room along the back of the house with gr...
$449,000
$449,000
Available: Right Now
Pride of ownership shows from every angle in this meticulously maintained home in the highly sought after Homewood Subdivision in Anderson, CA. This 3 bedroom, 2 bathroom home features vaulted ceilings, open concept floor plan, seperate laundry room ...
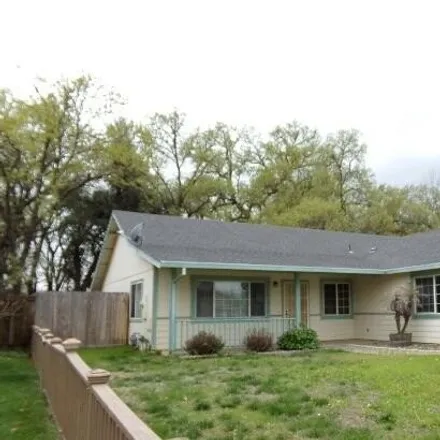
$451,500
$451,500
Available: Right Now
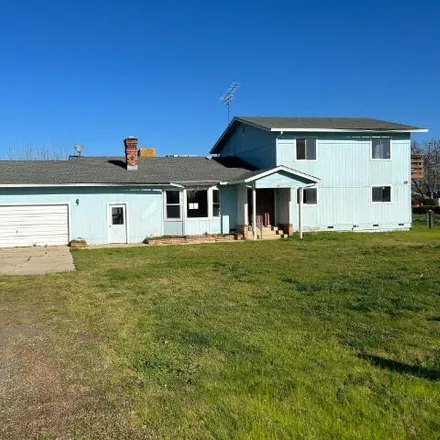
Just Listed: Country Home on 2.85 level Acres in Anderson. Bring your animals! Large Country Kitchen, Living Room with with large brick fireplace. Two Bedrooms / 1 Bathroom on the ground floorPLUS 3bedrooms / 1 more bathrooms added on the second floo...
$549,900
$549,900
Available: Right Now
Shows and feels like new construction but only better. This 2020 built home with one of the largest lots in the Skyview Estates is ready to move in. With 1748 sqft 3 bed, 2 bath split bedroom plan and open concept kitchen and living room this home is...
$299,900
$299,900
Available: Right Now
Anderson
According to statistics, the population in Anderson, CA amounts to 10,176, which shows decline 0% compared to the previous year. The median age of the city’s residents is 34. The average household income is $35,659, shifting growth 1% from the past year, and the average property value in Anderson, CA growth 10% to $174,000 throughout the year.
Household Income
The average household income in Anderson, CA grew from $35,216 to $35,659 in the past year. This data is an estimate based upon 3,906 households in Anderson, CA . The chart below presents how household income is distributed in Anderson, CA in comparison to the revenue allocation amid households nationally.
Property Value
According to data from last year, the average property value in Anderson, CA shifted from $158,000 to $174,000 throughout the year. The subsequent graph indicates the share of properties in the given price range in Anderson, CA in comparison to the median property value in the same price segment across the country. According to the data, the greatest share of Anderson, CA properties falls in the '$200,000 to $249,999' range, which is higher than the most significant median property across the country.
Property Taxes
One of the most important aspects for property owners is the amount of property taxes. This graph shows distribution of property taxes in Anderson, CA compared to median property taxes around the country. The prevalent amount of property taxes in Anderson, CA equals $1150, which is less than the national average.