Anza, CA 92539, USA apartments for sale
$790,000
$790,000
Available: Right Now
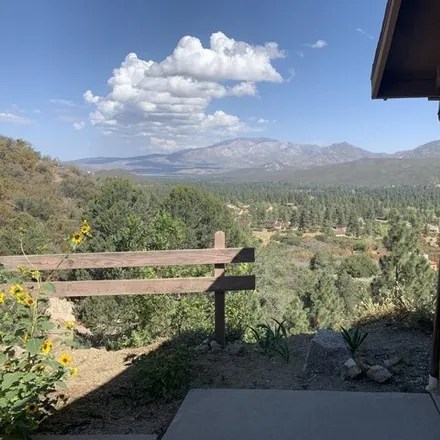
Elevated private home hideaway with 27 acres perched over looking Garner Valley with breath taking views. Hiking and equestrian trails next to and on the property. Trees around the property are Perry Pinyon, Coulter, Jeffrery, Oak, Cedar, Walnut, Cat...
$2,5M
$2,5M
Available: Right Now
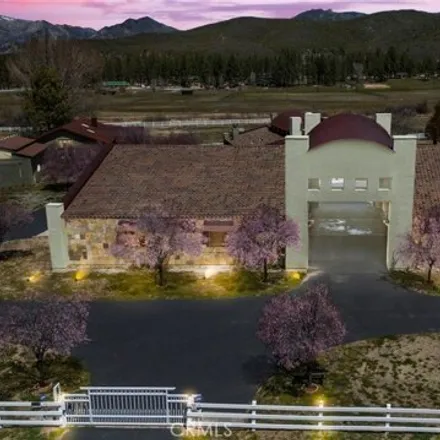
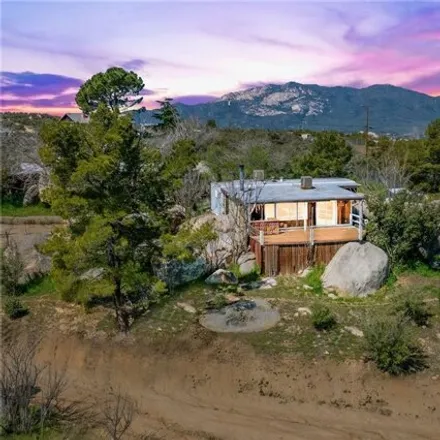
Once in a lifetime opportunity to own this stunning 6.28-acre private estate located a mere 28-minute drive to Palm Desert just off the famous Pines to Palms scenic 74 Hwy. This is one of the best kept secrets in southern California. Stay out of Palm...
$380,000
$380,000
Available: Right Now
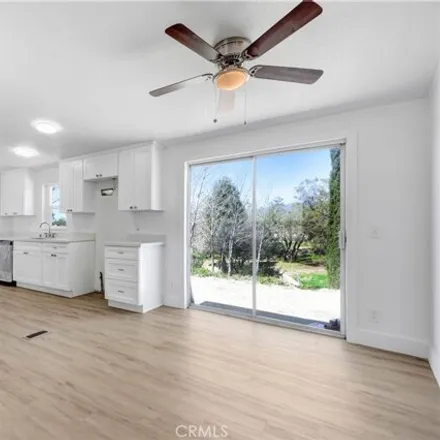
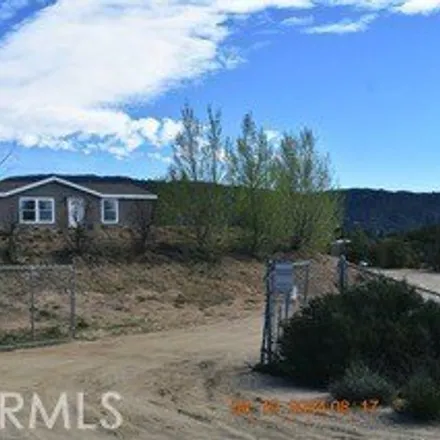
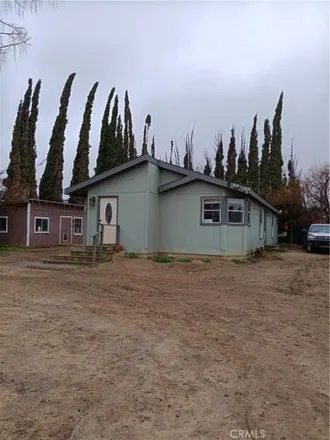
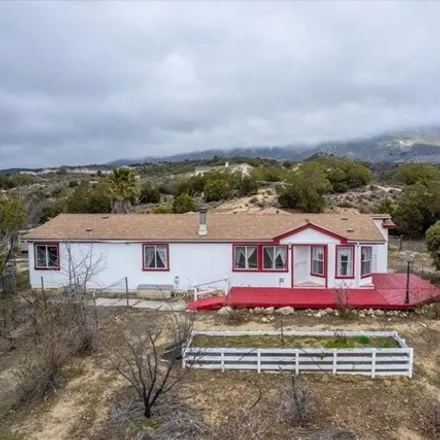
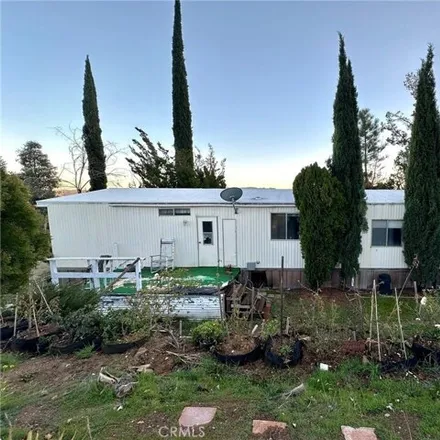
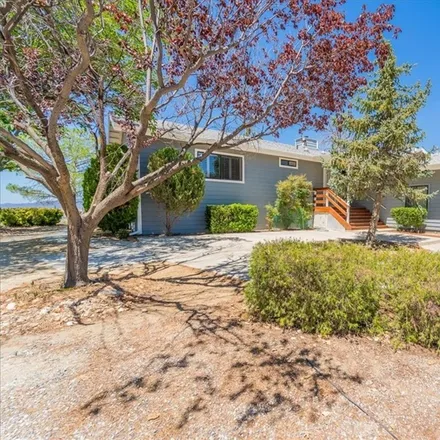
Remodeled beaty ! This three bedroom, two bath home is move-inREADY.From the driveway, you will see a fully fenced home with luscious Italian Cypress trees lining the front yard. As you walk inside, enjoy the spacious open floor plan with new ...
$340,000
$340,000
Available: Right Now
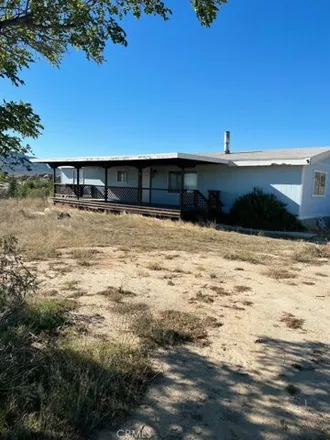
Welcome to your dream home! This beautiful 3-bedroom, 2-bath manufactured home is located on a stunning 5-acre lot in Riverside County, offering breathtaking views of the surrounding landscape. The cozy and inviting interior features a spacious livin...
$720,000
$720,000
Available: Right Now
Escape the hustle and bustle of city life and discover the tranquility of country living with this stunning property nestled in the heart of Anza. Situated on 5.58 acres of land, this retreat offers the perfect blend of natural beauty and modern amen...
$174,900
$174,900
Available: Right Now
This is what you ' Ve been looking for ! Over 2.5 acres with views ! This Anza property offers phenomenal views and endless potential. The spacious living room features a wood-burning pot-belly stove and access to a large deck, p...
$825,000
$825,000
Available: Right Now
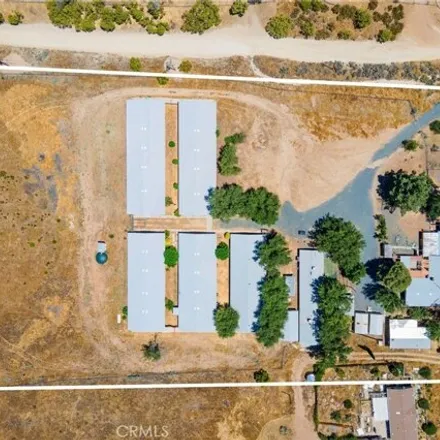
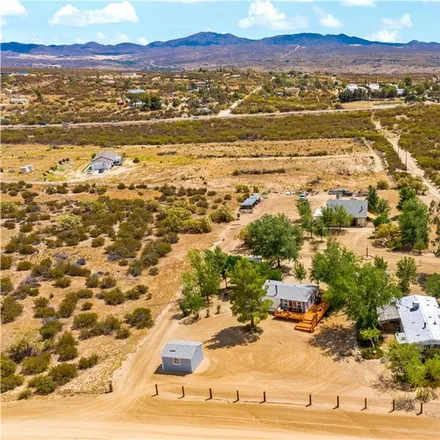
Opportunity to Own a Unique Property with 6 Outbuildings This 5-acre property in Anza is perfect for anyone who wants to live the farm life or start a business. It comes with a home built in 1965, and a small separately metered mobile home, but the r...
$335,000
$335,000
Available: Right Now
Charming home on a rural private lane in the Village of Anza. Just steps from churches restaurants, post office, groceries etc. A short drive too school. Kindergarten through High school. A perfect opportunity for someone just starting out or even a ...
$420,000
$420,000
Available: Right Now
Welcome home to this newly painted1782 SFhome. This 4 bedroom 2 bath home also comes with a complete very large climate controlled warehouse. The house has wood flooring, and has Brand New wood flooring in the Living room, dining room and kitchen. A ...
$369,000
$369,000
Available: Right Now
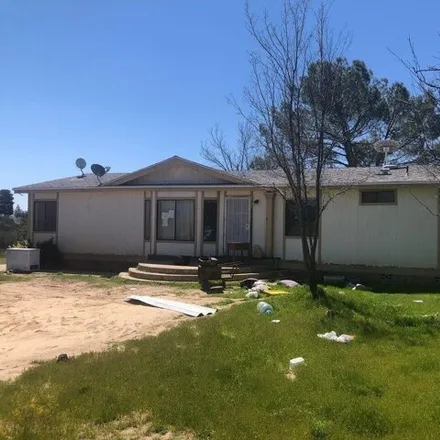
This nice and affordable home is ready to move in. It has 3 bedrooms and 2 bathrooms with new carpet and paint throughout. The living room has a wood burning stove and is open to dining area and a spacious kitchen. It has forced air heat and a window...
$429,000
$429,000
Available: Right Now
Who is looking for an Anza Homestead property!!?? This property and home has tons of potential at a great price. Bring your animals, grow your food, plant your food forest! Zoning is R-A-5 This 4.82 Acre property is all fenced with cross fencing arou...
$369,000
$369,000
Available: Right Now
Come see this ranch style stick built home in Anza. This 2 bedroom 1 bath 1298 sq ft home has lots of to offer. There is lots of natural lighting, open floor plan with a spacious living room. There is a 2 car garage with a bonus room for your own wor...
$259,999
$259,999
Available: Right Now
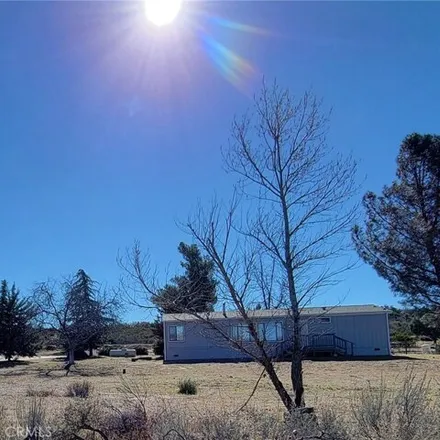
This 3 bedroom, 2 bath home is completely move in ready with a very spacious open floor plan. The home is sitting on 4.8 acres of mostly useable land with beautiful mountainous views and native brush. There is a 3 car garage on the property and a pri...
$439,000
$439,000
Available: Right Now
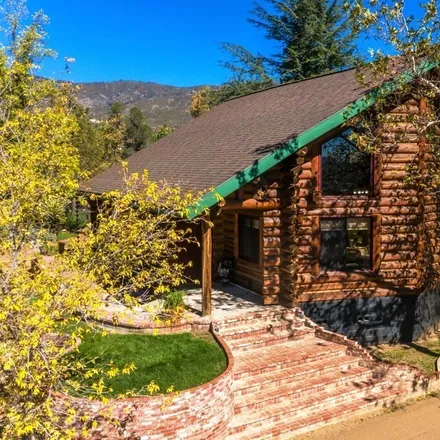
Super Unique Custom Built Anza home on 5 acres! This home started as a super small homestead home built in 1959. The current owners have lovingly transformed the home into a 2 bedroom, 2.5 bathroom home with 1766 square feet of living space. This add...
$685,000
$685,000
Available: Right Now
$225,000
$225,000
Available: Right Now
Located on 5 acres with mountain views, offers 3 beds, 2 baths, and a spacious workshop. Ideal opportunity to make this property your own and have growth on 5 acres. Just minutes away from Cahuilla casino and under an hour away from Temecula and Idyl...
$365,900
$365,900
Available: Right Now
$518,000
$518,000
Available: Right Now
$218,000
$218,000
Available: Right Now
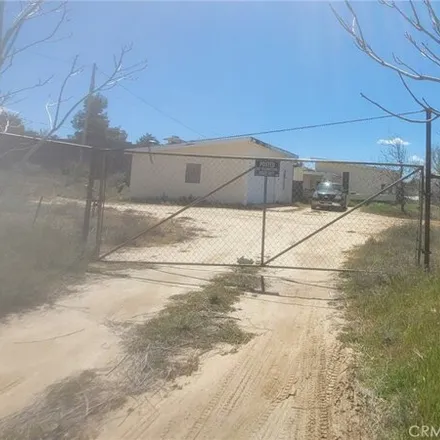
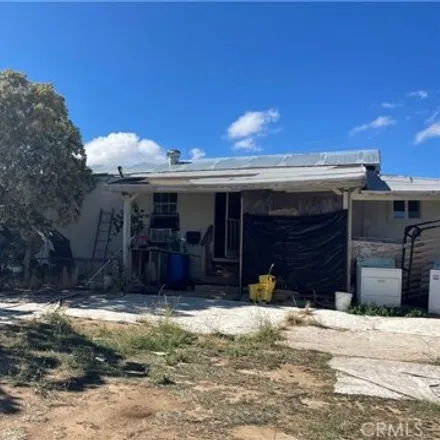
Manufactured Home Built on Mobile home lot with 2 bedroom and 1 bathroom. Approximately 670 sq ft. This manufactured home sits on a flat lot and usable land over 2 acres. Great for farming. There is a private well on this property. Property is fully ...
$285,000
$285,000
Available: Right Now
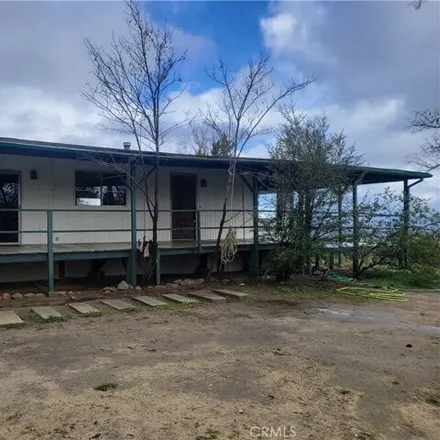
Great location and breathtaking view. Just off paved street. House has a wrap around deck with sweeping views of the valley. The exterior is newly painted. The interior has new flooring, freshly painted ceiling and cabinets and a wood stove in the li...
$360,000
$360,000
Available: Right Now
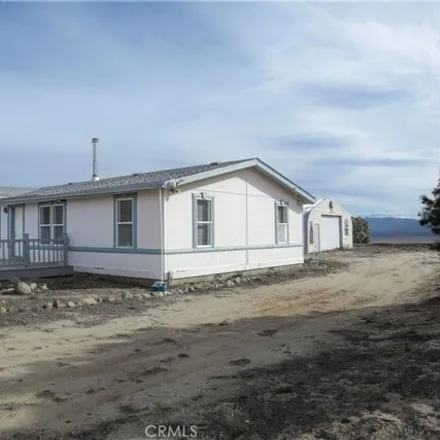
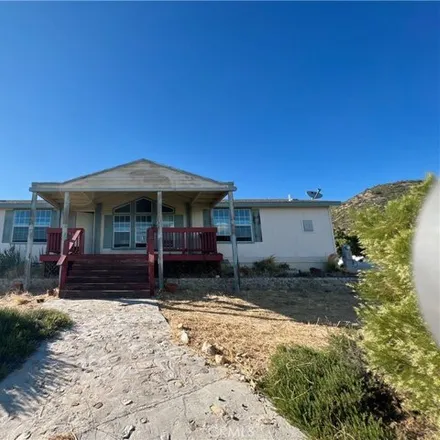
Motivated seller ! This manufactured home with a great front porch. It features 3 bedrooms and 2.75 baths, a living room with wood burning fireplace, and a Spacious kitchen with a center island. Every room has great lighting. Private setting a...
$489,000
$489,000
Available: Right Now
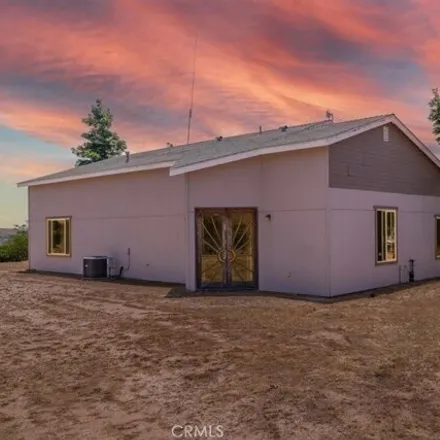
This single-story 4 bedroom, 2.5 bath modular home on 2.67 acres with panoramic views. This manufactured home, set on a permanent foundation includes vaulted ceilings, a master bedroom, an ensuite master bathroom with soaking tub and walk-in closet. ...
Anza
According to statistics, the population in Anza, CA amounts to 3,284, which shows growth 31% compared to the previous year. The median age of the city’s residents is 38. The average household income is $42,023, shifting growth 44% from the past year, and the average property value in Anza, CA growth 7% to $156,400 throughout the year.
Household Income
The average household income in Anza, CA grew from $29,129 to $42,023 in the past year. This data is an estimate based upon 1,049 households in Anza, CA . The chart below presents how household income is distributed in Anza, CA in comparison to the revenue allocation amid households nationally.
Property Value
According to data from last year, the average property value in Anza, CA shifted from $146,700 to $156,400 throughout the year. The subsequent graph indicates the share of properties in the given price range in Anza, CA in comparison to the median property value in the same price segment across the country. According to the data, the greatest share of Anza, CA properties falls in the '$150,000 to $174,999' range, which is higher than the most significant median property across the country.
Property Taxes
One of the most important aspects for property owners is the amount of property taxes. This graph shows distribution of property taxes in Anza, CA compared to median property taxes around the country. The prevalent amount of property taxes in Anza, CA equals $1150, which is less than the national average.