Arrow Rock, MO, USA apartments for sale
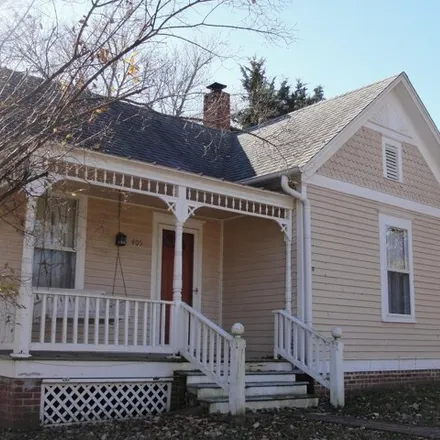
$265,000
$265,000
Available: Right Now
Enjoy the tranquility within historic Arrow Rock from the swing on your front porch. This charming turn-of-the century home was built in 1910 and had a major addition in the late 1900's. Two large living rooms, a full size dining room, and a kitchen ...
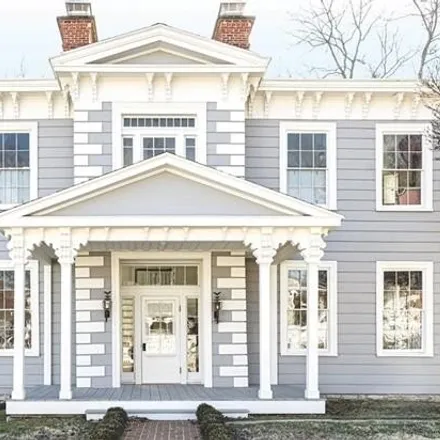
$699,000
$699,000
Available: Right Now
This grand home in the heart of the National Historic Landmark village of Arrow Rock, Missouri, was constructed in 1845 as a home for theJ.A.J.Aderton family. Over the subsequent years, it sheltered some of Arrow Rocks most prominent early families, ...

$349,950
$349,950
Available: Right Now
Don't miss your chance to own a well taken care of historic home! You'll fall in love with the quiet City of Arrow Rock. This home is perched in the prime spot, right on Main ST, near the Lyceum Theater, tavern, and shops. Enter through the white pic...
Arrow Rock
According to statistics, the population in Arrow Rock, MO amounts to 45, which shows growth 32% compared to the previous year. The median age of the city’s residents is 64. The average household income is $n/a, shifting n/a% from the past year, and the average property value in Arrow Rock, MO decline -14% to $112,500 throughout the year.
| Population | 45 |
| Median Age | 64.3 |
| Number Of Employees | 19 |
| Median Property Value | $112,500 |
Household Income
The average household income in Arrow Rock, MO grew from $n/a to $n/a in the past year. This data is an estimate based upon 30 households in Arrow Rock, MO . The chart below presents how household income is distributed in Arrow Rock, MO in comparison to the revenue allocation amid households nationally.
Property Value
According to data from last year, the average property value in Arrow Rock, MO shifted from $131,300 to $112,500 throughout the year. The subsequent graph indicates the share of properties in the given price range in Arrow Rock, MO in comparison to the median property value in the same price segment across the country. According to the data, the greatest share of Arrow Rock, MO properties falls in the '$90,000 to $99,999' range, which is lower than the most significant median property across the country.
Rent vs. Own
Property Taxes
One of the most important aspects for property owners is the amount of property taxes. This graph shows distribution of property taxes in Arrow Rock, MO compared to median property taxes around the country. The prevalent amount of property taxes in Arrow Rock, MO equals $800, which is less than the national average.