Artesia, CA, USA apartments for sale
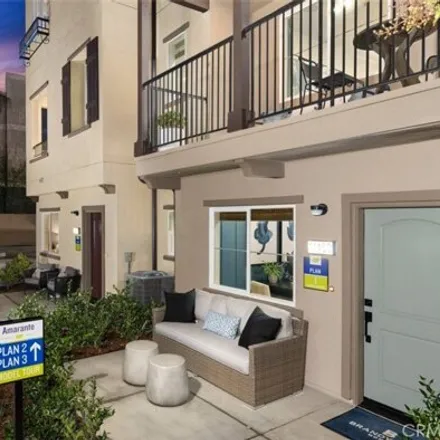
$866,990
$866,990
Available: Right Now
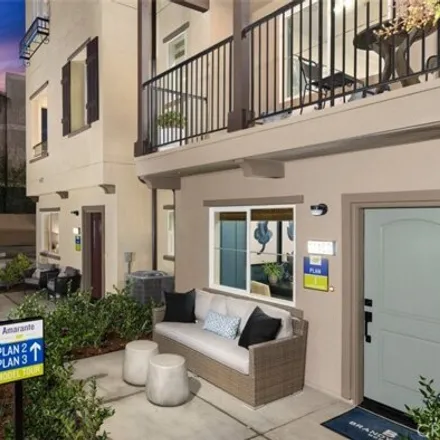
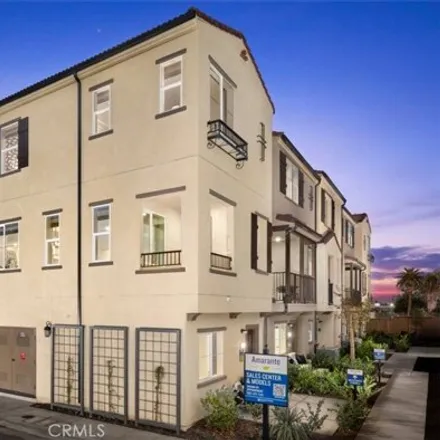
It's time to experience the beauty and abundance of home at Amarante. Design is right at home in Plan 1! It includes a first-floor Office/Flex space with 1/2 bath for those that need a home office or extra living area. Upstairs, youll love the flow o...
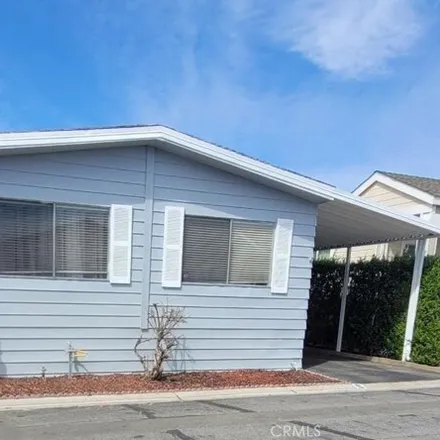
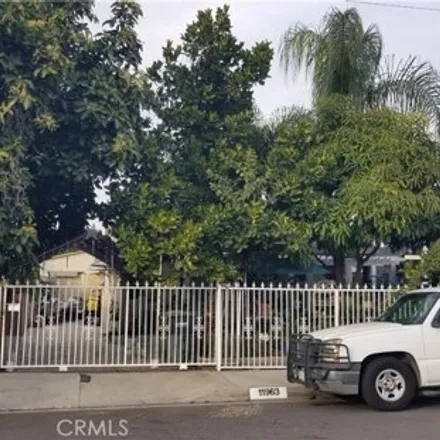
$275,000
$275,000
Available: Right Now
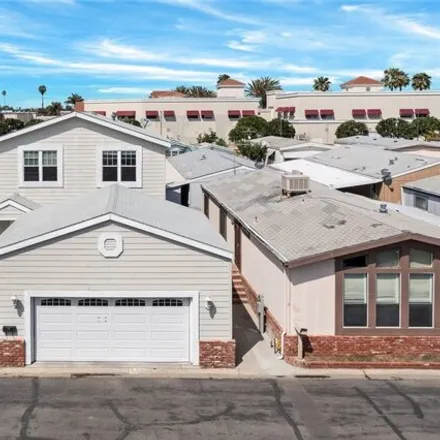
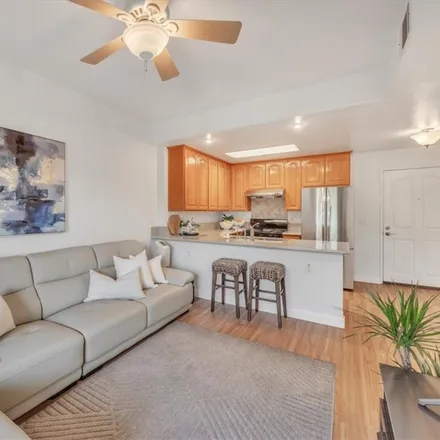
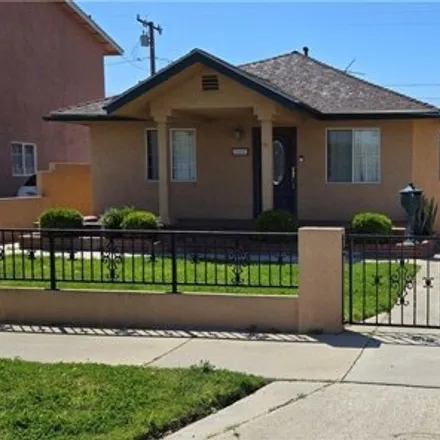
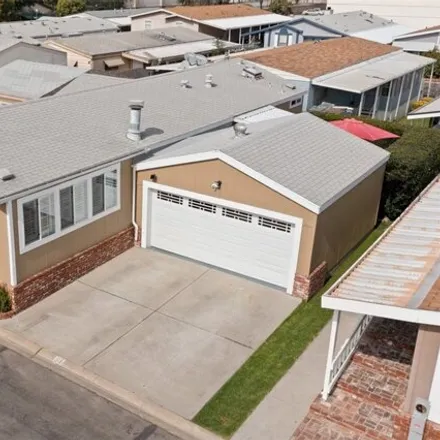
Explore elevated living in Artesia! This two-story manufactured home offers 3 bedrooms, 3 baths, separate washer and dryer room, central air and heater, 2-extra large car garage, The allure doesn't stop there-step inside to find gorgeous hardwood flo...
$438,000
$438,000
Available: Right Now
$1,19M
$1,19M
Available: Right Now
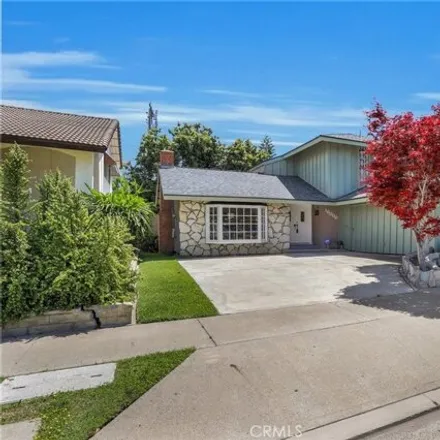
Located in a great area of Cerritos and walking distance to the Cerritos mall, this updated four bedroom house is ready for its new owners. Features include: Large living room with vaulted ceilings, Fireplace and Window bench, Big Family room that is...
$970,990
$970,990
Available: Right Now
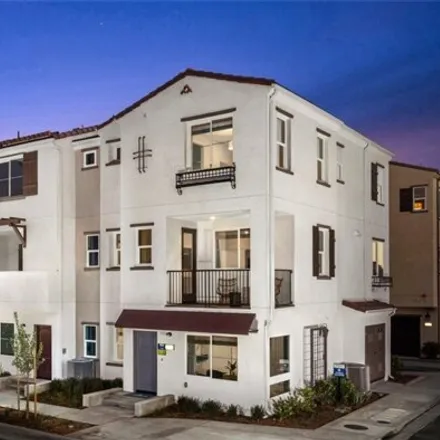
It's time to experience the beauty and abundance of home at Amarante. Design is right at home in Plan 3! It includes a first-floor bedroom and full bath for loved ones and guests. Upstairs, youll love the flow of the open floor plan and pampering pri...
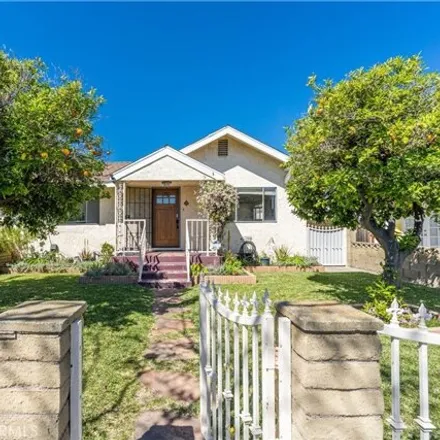
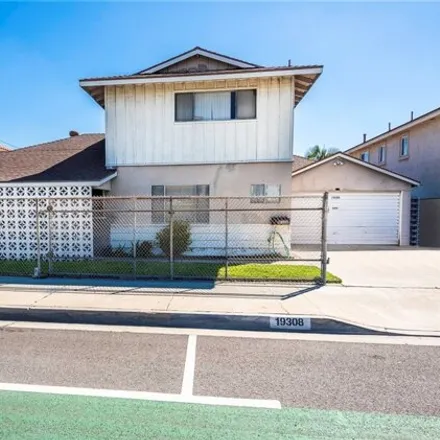
$799,000
$799,000
Available: Right Now
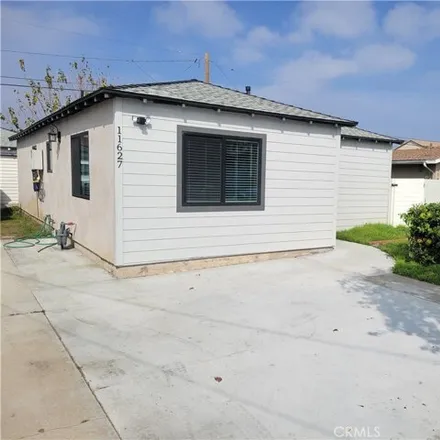
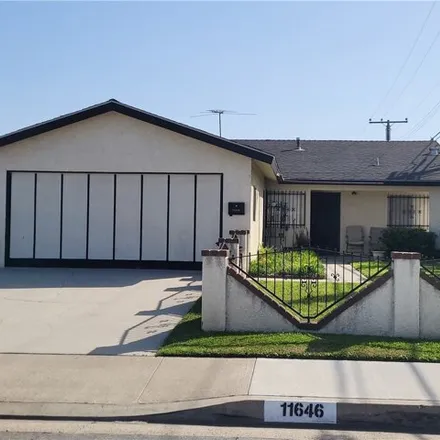
Wonderful Artesia home situated in the heart of the City of Artesia. Consisting of 2 bedrooms 1 bathroom, living room, dining area, beautiful kitchen, laundry area, nice rear yard, long driveway and centrally located in Artesia. Near shopping centers...
$934,990
$934,990
Available: Right Now
Introducing our stunning corner model home, flooded with natural light and boasting$74, 000in upgrades. From upgraded flooring to a gourmet kitchen featuring White Shaker style Cabinets, Simply White Quartz Countertops, and stainless steel Samsung ap...
$875,000
$875,000
Available: Right Now
Welcome to your family home a modern open floor plan with 3 bedroom 2 bathrooms. The kitchen and living room are open modern layout. Your family will enjoy. The prime location is a diamond. Close to Cerritos mall, restaurants, walking distance to sho...
$220,000
$220,000
Available: Right Now
Great opportunity to live in a manufactured home located in a great location in Artesia boarding Cerritos neighborhood , spacious home offers an open floor, features 3 bedrooms, 2 full bathrooms , New exterior paint , covered parking for 3 cars, Larg...
$1,6M
$1,6M
Available: Right Now
This is an opportunity to own a rare, charming oasis in the heart of Artesia, CA. This remarkable property boasts 7 bedrooms, 4 bathrooms, and over2, 800square feet of luxurious living space. Situated on an expansive lot spanning nearly8, 000square f...
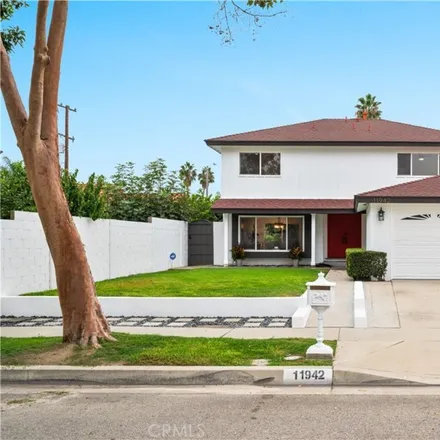
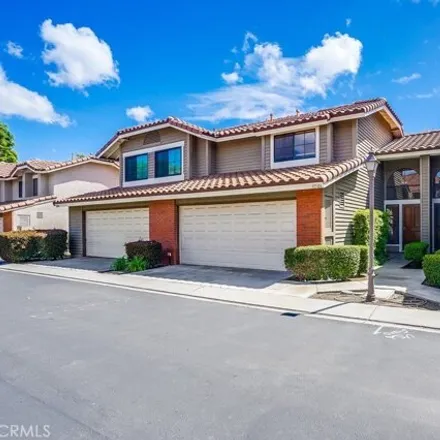
$1,15M
$1,15M
Available: Right Now
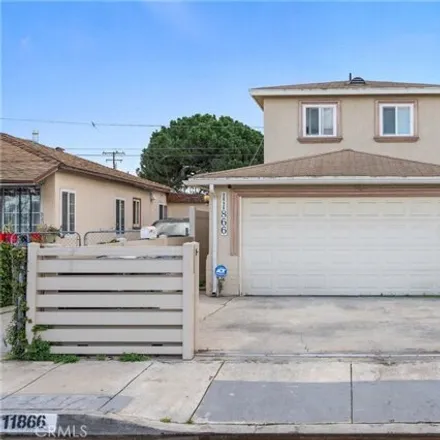
You'll fall in love with this completely remodeled two-story home the moment you pull up. Situated on a quiet, tree-lined street, it boasts one of the largest lot sizes in the community. The exterior and interior have been freshly painted, and luxury...
$2,3M
$2,3M
Available: Right Now
$437,000
$437,000
Available: Right Now
$970,000
$970,000
Available: Right Now
$747,500
$747,500
Available: Right Now
$1,2M
$1,2M
Available: Right Now
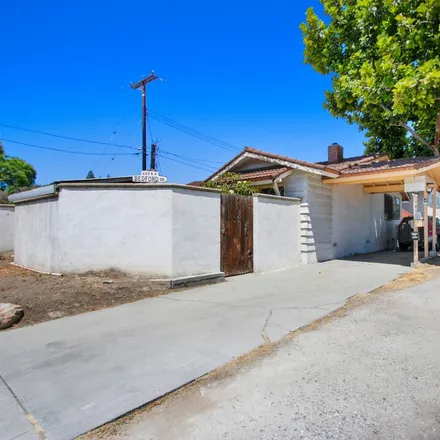
$575,000
$575,000
Available: Right Now
Great location. Close to everything. Near the 91 and 605 freeway. It has two beds and one bath. Front yard has palm and fruit trees. It has 875 sq ft and amost4, 000sq ft lot. It has a long driveway on the side that an RV can fit or 4 cars aside from...
$866,990
$866,990
Available: Right Now
It's time to experience the beauty and abundance of home at Amarante. Design is right at home in Plan 1! It includes a first-floor Office/Flex space with 1/2 bath for those that need a home office or extra living area. Upstairs, youll love the flow o...
$688,000
$688,000
Available: Right Now
This 2-story townhome in Cerritos is nestled within a serene, gated community and in a Planned Unit Development (PUD) within the ABC School District. Upon entry, you're greeted by a welcoming living room adorned with wood flooring, a cozy fireplace, ...
$949,900
$949,900
Available: Right Now
Are you ready to add your personal touches to your future dream home? This is perfect for you! As you enter, you are welcomed to the spacious living area. You can head into the kitchen where the heart is. Head down the hallway you'll find 2 full bath...
$275,000
$275,000
Available: Right Now
Welcome to your dream home in the sought-after Artesia area! Featuring 3 bedrooms, 2 bathrooms, and not one but two spacious living rooms and one with a cozy fireplace for those cold days. This gem comes complete with ample living space of1, 440,an o...
$699,999
$699,999
Available: Right Now
Charming Two-Story Residence in Prestigious ABC School District Discover the perfect blend of comfort and convenience in this delightful 3-bedroom, 1.5-bath home, nestled in the highly sought-after ABC school district. This residence shines with new ...
$887,998
$887,998
Available: Right Now
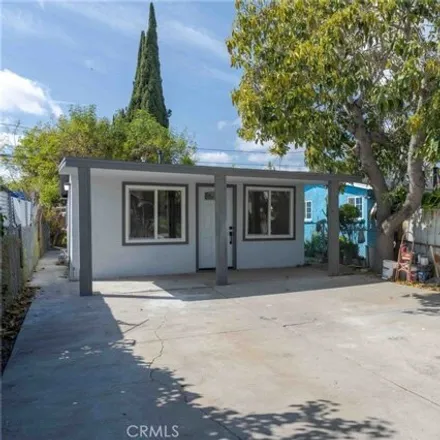
Welcome to your new home or investment property, this home has been completely taken down to the studs and is a modern open floor plan with 3 bedroom 2 bathrooms. The owners have spared no expense on this property. You will love this open concept lay...
$527,000
$527,000
Available: Right Now
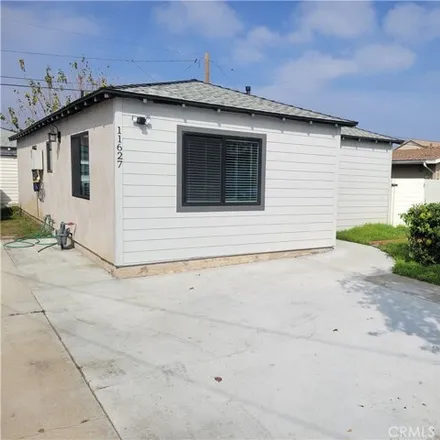
Nicely remodeled 2 bedroom and 1 bathroom cozy home for those first time homebuyers who are eager to purchase a home to call their own. This property features a brand new roof, brand new water heater, floorings throughout the home, nice granite count...
$850,000
$850,000
Available: Right Now
Wonderful Artesia Home on a large lot. Consisting of 3 bedrooms, 2 bathrooms, Dining Room, Living Room with fireplace, enclosed patio/sunroom, centralAC/HVC, 2car attached garage and much more to see. Home is located in the heart of Artesia and is ce...
$959,999
$959,999
Available: Right Now
Walk into equity in this move-in-ready home in the Cerritos community! The interior and exterior have been freshly painted, giving the home a modern and updated look. The kitchen has been upgraded with brand-new stainless-steel appliances, new carpet...
Artesia
According to statistics, the population in Artesia, CA amounts to 16,853, which shows decline 0% compared to the previous year. The median age of the city’s residents is 39. The average household income is $62,702, shifting growth 7% from the past year, and the average property value in Artesia, CA growth 4% to $437,200 throughout the year.
| Population | 16,853 |
| Median Age | 39 |
| Poverty Rate | 12% |
| Household Income | $62,702 |
| Number Of Employees | 7,720 |
| Median Property Value | $437,200 |
Household Income
The average household income in Artesia, CA grew from $58,651 to $62,702 in the past year. This data is an estimate based upon 4,517 households in Artesia, CA . The chart below presents how household income is distributed in Artesia, CA in comparison to the revenue allocation amid households nationally.
Property Value
According to data from last year, the average property value in Artesia, CA shifted from $419,500 to $437,200 throughout the year. The subsequent graph indicates the share of properties in the given price range in Artesia, CA in comparison to the median property value in the same price segment across the country. According to the data, the greatest share of Artesia, CA properties falls in the '$500,000 to $749,999' range, which is higher than the most significant median property across the country.
Rent vs. Own
Property Taxes
One of the most important aspects for property owners is the amount of property taxes. This graph shows distribution of property taxes in Artesia, CA compared to median property taxes around the country. The prevalent amount of property taxes in Artesia, CA equals $3000, which is less than the national average.