Auburn, NY 13021, USA apartments for sale
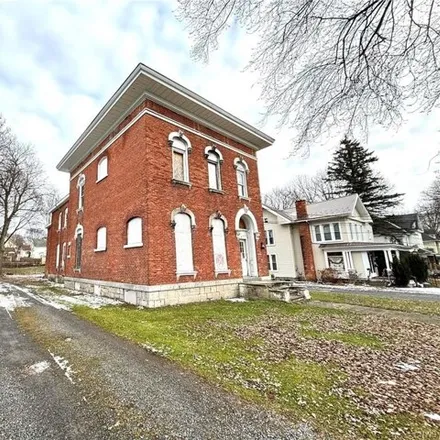
$65,000
$65,000
Available: Right Now
This once beautiful home needs to be restored back to its glory. The home is currently gutted to the studs and gorgeous bricks. The property is zoned R2 and was once a multi family home. This property could potentially provide the opportunity for a m...

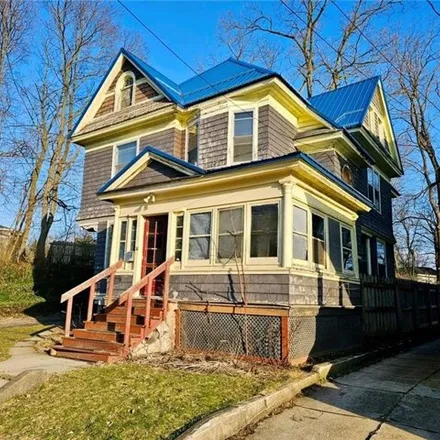
$114,900
$114,900
Available: Right Now
Opportunity awaits with this four bedroom, one full bathroom home with almost2, 000square feet of living space and a nice yard for entertainment! 44 Walnut St is situated in the Owasco Elementary school zone, and also in close proximity to downtown A...
$149,000
$149,000
Available: Right Now
30 Westlake Ave is located in the heart of the city and only one block to Genesee St, Wegmans, YMCA,theatre, shops and restaurants. This large home has2, 180of living space The interior offers the old house charm, with well-preserved woodwork though ...

$159,900
$159,900
Available: Right Now
Desirable Owasco area! Solid three bedroom, one and half bath. Large living room. Formal dining room and first floor laundry. Large master bedroom that includes a connected sitting room. Garage with overhead door opener. Large driveway that easily ac...

$359,000
$359,000
Available: Right Now
This charming Cape Cod home has the location you are looking for and the curb appeal you have dreamed of! Setting a comfortable tone, the meticulously groomed curb appeal welcomes you with a stately stone front, solid cement driveway and beautiful la...

$199,900
$199,900
Available: Right Now
This solid home at 7 North Park St offers a comfortable and convenient lifestyle. The1, 738square feet of living space features hardwood floors and plenty of natural light throughout. The wood burning fireplace in the living room creates a warm and i...

$279,900
$279,900
Available: Right Now
This charming house features 2 bedrooms and 2 full baths, plus a convenient half bath in the basement. The first floor laundry can also be converted back into a smaller bedroom. Located in a desirable walking neighborhood, it offers the perfect combi...

$249,900
$249,900
Available: Right Now
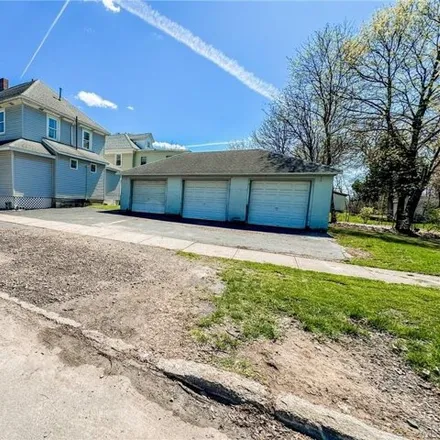
Investment Opportunity: Two Houses + Vacant Lot with Income Potential. Discover a rare investment opportunity with this property featuring two distinct houses and an adjoining vacant lot. The Main House Includes 3 Bedrooms, 1 Full Bath, Family Room, ...

$102,500
$102,500
Available: Right Now
This Beauty just hit the market - newly listed historic home is a remarkable opportunity for buyers seeking to restore a piece of local heritage in a sought-after neighborhood. With its generous layout, including a full kitchen, first-floor laundry, ...

$146,500
$146,500
Available: Right Now
Cute as a button describes this Cape Cod style home! Eat-in Retro Kitchen, Nice size Livingroom, 1st Floor Bedroom and Additional Room that could be a Den, Office or converted into another Bedroom. It is thought that there are hardwoods under much of...

$424,900
$424,900
Available: Right Now
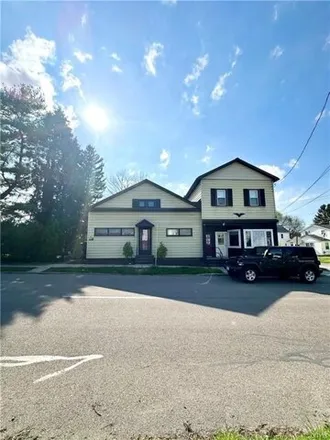
Attention investors: This rare fully Occupied and Stabilized 7-Unit Apartment Building is located in Auburn, NY and is a great investment opportunity! All 7 units are currently leased with separate electric meters to provide immediate and stab...

$190,000
$190,000
Available: Right Now
Welcome to this unique investment opportunity in the heart of downtown Auburn, NY! This charming property features 7 one bedroom units, perfect for renting out, living in or using for a business venture. This spacious property offers potential for mu...

$239,900
$239,900
Available: Right Now
Charming Cape Code: Spacious 4 Bedroom with Large Yard. Welcome to this delightful Cape Cod style home in the heart of Auburn. This well-maintained residence features four generously sized bedrooms and two full bathrooms. Inside discover a warm and i...
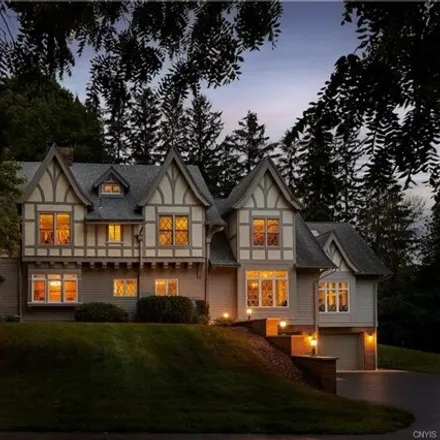
$1,2M
$1,2M
Available: Right Now
Step into the magnificence of 144 South Street, Auburn, NY, where every corner exudes unparalleled charm and sophistication. As you enter this enchanting Tudor-style home, be prepared to be swept away by the awe-striking craftsmanship and allure that...

$289,000
$289,000
Available: Right Now
Absolutely beautiful 4 bed 2 and 1/2 bath Ranch on a peaceful cul de sac. Updated open eat in kitchen with granite counters, island, plenty of cabinet space and hardwood floors. Large sun filled living room overlooking the tranquil park like, well-ma...
$239,900
$239,900
Available: Right Now
Unique investment opportunity in Auburn! This property features three apartments, each boasting individual kitchens, bathroom, and 2+ bedrooms. The bottom apartment holds exciting potential with a large bar area that can be converted into two additio...

$299,900
$299,900
Available: Right Now
This Versatile Property Has Tons of Potential for Both Professional and Residential Use. This Turnkey, Totally Remodeled Downstairs Doctors Office, Features Numerous Rooms, Ideal for Medical Practice Set Up. It Boasts Gleaming Hardwoods, Luxury Vinyl...

$4,5M
$4,5M
Available: Right Now
Rare opportunity to own the historic Kings and Queens Court, a one-of-a-kind 60-unit property in beautiful Auburn, NY. The two landmark buildings feature meticulously restored units with a portion of utilities paid by tenants, coin operated laundry, ...

$310,000
$310,000
Available: Right Now
Investors!! this newly and beautifully renovated 3 unit multi-family is ideally walking distance to downtown Auburn. Fresh interior and exterior paint. Each unit has renovated bathrooms in which two of those have marble tub surround. Numerous new ins...

$142,500
$142,500
Available: Right Now
Welcome to a charming 3-bed, 2-bath ranch-style home in the prospect heights neighborhood. Features include a living room, formal dining room, kitchen with first-floor laundry, a primary bedroom with its own bathroom, partially finished basement, and...

$129,900
$129,900
Available: Right Now
Welcome to this spacious home with untapped potential awaiting its new owner. After entering from the open porch, you are greeted with a formal dining room and living room with bay windows that allows in the natural light. Downstairs you have 1st flo...
$325,000
$325,000
Available: Right Now
Unique multi-faceted property offers a variety of amenities and opportunities for owner occupants and investors alike. The salon has been totally remastered from top to bottom with elegant/modern finishes including a separate customer seating area, r...
Auburn
According to statistics, the population in Auburn, NY amounts to 26,962, which shows decline -1% compared to the previous year. The median age of the city’s residents is 39. The average household income is $40,708, shifting growth 2% from the past year, and the average property value in Auburn, NY decline 1% to $97,800 throughout the year.
What is the Average Price of Apartments for Sale in Auburn, NY, 13021?
The average sale price for apartment in Auburn, NY, 13021: $236,416
(+11%)
| Month | Median Price |
|---|---|
| Jun 2024 |
$329,679
|
| May 2024 |
$329,078
|
| Apr 2024 |
$297,161
|
| Mar 2024 |
$297,161
|
| Feb 2024 |
$297,161
|
| Jan 2024 |
$297,161
|
| Month | Median Price |
|---|---|
| Jun 2024 |
$236,416
|
| May 2024 |
$212,963
|
| Apr 2024 |
$150,115
|
| Mar 2024 |
$150,115
|
| Feb 2024 |
$150,115
|
| Jan 2024 |
$150,115
|
Household Income
The average household income in Auburn, NY grew from $40,005 to $40,708 in the past year. This data is an estimate based upon 11,572 households in Auburn, NY . The chart below presents how household income is distributed in Auburn, NY in comparison to the revenue allocation amid households nationally.
Property Value
According to data from last year, the average property value in Auburn, NY shifted from $97,200 to $97,800 throughout the year. The subsequent graph indicates the share of properties in the given price range in Auburn, NY in comparison to the median property value in the same price segment across the country. According to the data, the greatest share of Auburn, NY properties falls in the '$100,000 to $124,999' range, which is lower than the most significant median property across the country.
Property Taxes
One of the most important aspects for property owners is the amount of property taxes. This graph shows distribution of property taxes in Auburn, NY compared to median property taxes around the country. The prevalent amount of property taxes in Auburn, NY equals $3000, which is less than the national average.