Austin, MN 55912, USA apartments for sale

$449,900
$449,900
Available: Right Now
Nestled on a beautiful SW lot, this exquisite custom-built 2-Story residence exudes elegance and luxury. The spacious open floor plan boasts a gourmet kitchen, informal dining area, and a cozy living room with a gas fireplace. The main floor also fea...

$439,900
$439,900
Available: Right Now
Lovely, spacious custom-built 4BR 3-bath Rambler in great SW location. Has wonderful open floor plan with multiple eating areas, two fireplaces, private owner's suite, finished lower level with an abundance of natural light, main floor laundry and at...

$219,000
$219,000
Available: Right Now
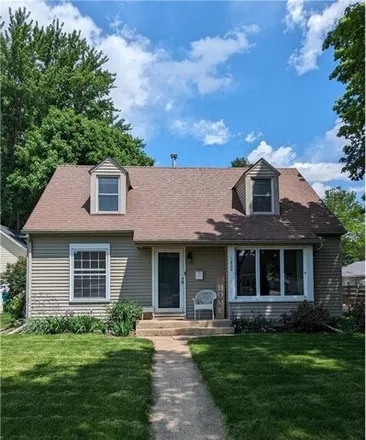
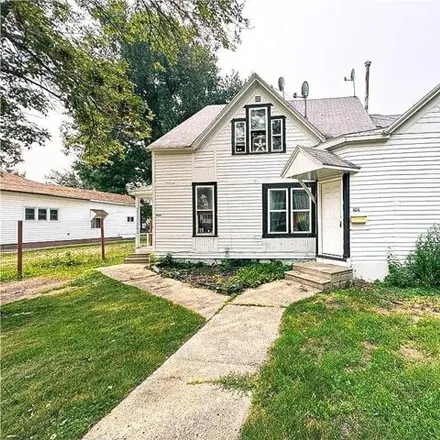
Superb, well maintained 3BR 3-bath 1.5-Story on nice SW lot in good location. Has hardwood floors, dining room, main floor family room with free standing gas fireplace, baths on each floor and finished lower level. Also has new windows, steel siding,...
$219,000
$219,000
Available: Right Now
This charming property features a cozy gas fireplace, a spacious pantry, and an updated kitchen with beautiful granite countertops. Each of the three bedrooms comes with its own walk-in closet, providing ample storage space. With new carpet throughou...

$255,000
$255,000
Available: Right Now
Move in ready ! This 3 bed, 2 bath home with a double garage is freshly updated and conveniently located close to shopping, schools and recreational facilities. This home was recently updated with a new furnace with 10 year parts warranty and ...
$519,999
$519,999
Available: Right Now
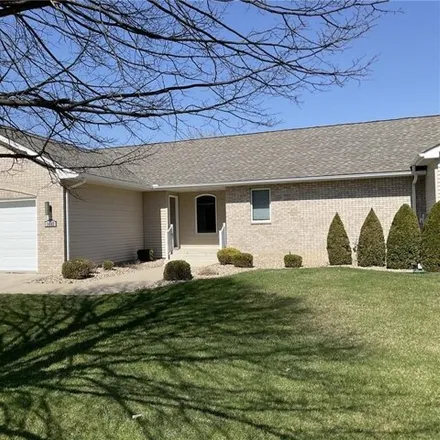
Beautifully spacious 5 bedroom 3 1/2 bathroom, custom-built ranch style home with a three-car attached garage. The home is 3991 square feet on a.35 size lot with an abundance of storage, smoke-free and pet-free. A must see! Main: Vaulted ceiling and ...

$240,000
$240,000
Available: Right Now
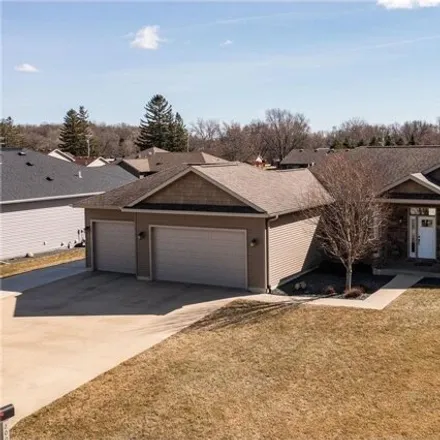
Are you seeking single-level living? This well-constructed rambler is ready for its next owner. The main floor offers two spacious bedrooms with ample closet space. The updated kitchen includes a dedicated dining area, complemented by a well-lit livi...
$179,000
$179,000
Available: Right Now
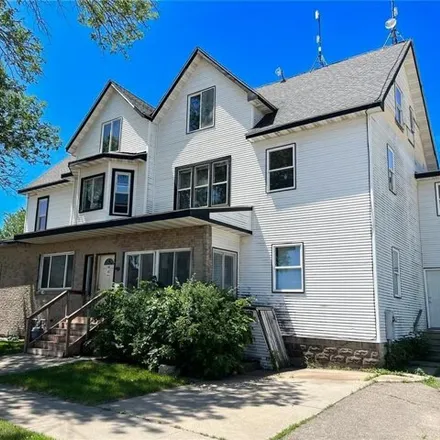
Uncover remarkable potential in Austin, Minnesota, with this duplex steeped in historical richness. A testament to Southern Minnesota's heritage, this unique property awaits transformation into an iconic residence featuring every modern amenity. The ...
$197,987
$197,987
Available: Right Now
Reduced $50, 000.00 for quick sale !! We're pleased to present the opportunity to acquire a great property in a highly demanded Austin, MN. Including 5 bedrooms and 2 bathrooms, you are going to enjoy the large3, 700sqft that composes this Hou...
$209,000
$209,000
Available: Right Now
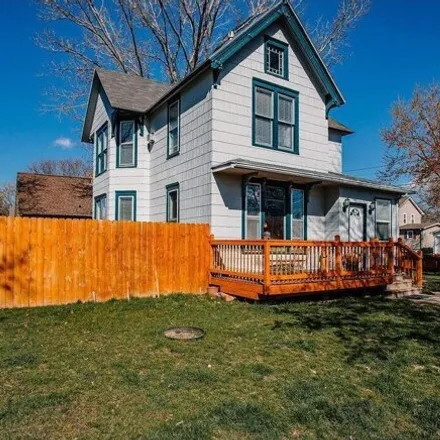
Beautifully maintained home which includes original hardwood floors, 2 bedrooms on the main floor. Also has a relaxing fenced in outdoor space with plenty of privacy and shade. All appliances will stay including the washer and dryer. There are built-...

$120,000
$120,000
Available: Right Now
Check out this2BR 1.5story home in great location close to schools. Home has main floor bedroom and bath, high efficiency furnace 2002 with new heat exchanger and sensors in 2017, eco-friendly freon central air 2017, steel siding on home with blown i...

$299,900
$299,900
Available: Right Now
All class! Take a look at this 4 bedroom split level home located in lovely NW location. Large eat in kitchen with doors off to private deck, formal dining room, 3 bedrooms, 2 bathrooms on main level. Lower level offers another bedroom, bath, family ...

$184,900
$184,900
Available: Right Now
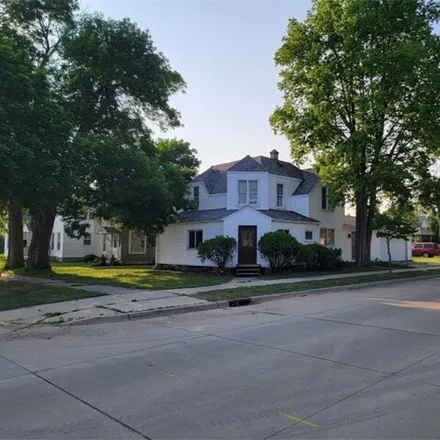
This home is located in a perfect NE location. The house is situated on a redone street and abuts a large city park. The home features replacement windows, hardwood floors, attached garage, newer mechanicals, large eat-in kitchen, large shed and so m...

$194,900
$194,900
Available: Right Now
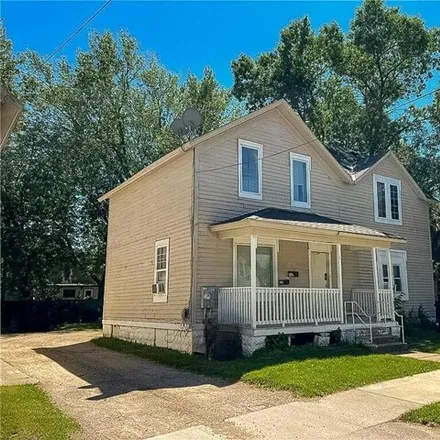
This is the place you've been looking for! Single-Family home with the option for a duplex; this property is ideal for owner- occupancy. Convenient location, minutes from many amenities and I-90. This 2-story home has 2200 sq ft of finished living ar...
$389,000
$389,000
Available: Right Now
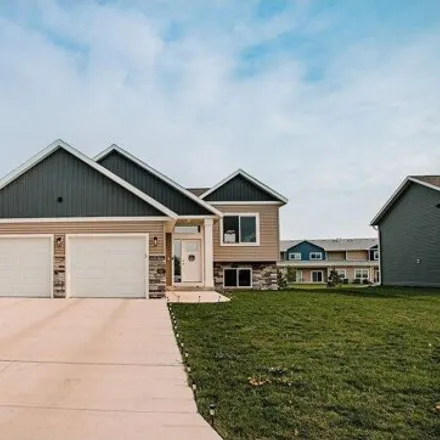
Built in 2023, this home is practically brand new! Quality finishes and custom touches make this home a must see! With 4 bedrooms, 2 baths, and a corner lot, there's plenty of space. The open basement provides lots of space to entertain. Plus, it's c...

$259,000
$259,000
Available: Right Now
Outstanding 6 bed, 2 bath duplex situated in the heart of Austin, MN. With a massive2, 676sq ft of living space split between two mirrored units, this property offers unbeatable value and income potential. Separate laundry rooms, garage spaces, and p...

$120,000
$120,000
Available: Right Now
Discover an incredibly affordable gem in the heart of Austin! This charming two-bedroom, one-bath home is perfect for first-time buyers or savvy investors. Featuring a spacious two-car garage, it offers ample storage and convenience. The cozy interio...
$479,400
$479,400
Available: Right Now
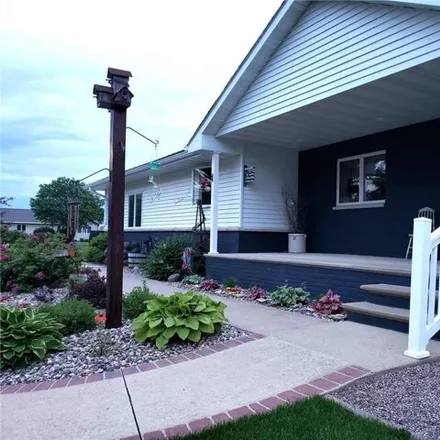
One-story homes rarely come on the market in this highly desired neighborhood; and this one is a gem. First of all, with the back of the house having southern exposure, all of the large windows make this home very naturally bright and pleasant. The h...

$209,000
$209,000
Available: Right Now
Superb, spacious 4BR 3-bath 1.5-Story home in SW. Has main floor family room, main floor laundry, living/dining room, two main floor bathrooms and two main floor bedrooms. Two bedrooms, office and bathroom up. Game room and work area in the basement....
$310,000
$310,000
Available: Right Now
Discover this stately fourplex nestled in the heart of Austin, Minnesota, offering a harmonious blend of classic elegance and modern convenience. Ideally located in close proximity to contemporary amenities, this property presents an exciting investm...
$118,000
$118,000
Available: Right Now
Lower level unit vacant. Upper level unit rented at $650 a month. Buyer and agent to verify all information herein. Currently operated as a duplex on a month-to-month lease. Schedule closing 30 days+ to accommodate an owner occupant move-in. Versatil...
$358,900
$358,900
Available: Right Now
Highest quality custom built 3BR 3-bath townhome located in Keystone Townhomes at Southpointe. Custom kitchen with solid surface countertops, rollout cabinet and pantry shelves. Complete with all appliances, spacious dining area, main floor family ro...
Austin
According to statistics, the population in Austin, MN amounts to 24,882, which shows decline 0% compared to the previous year. The median age of the city’s residents is 38. The average household income is $46,923, shifting growth 3% from the past year, and the average property value in Austin, MN decline 1% to $99,500 throughout the year.
What is the Average Price of Apartments for Sale in Austin, MN, 55912?
| Month | Median Price |
|---|---|
| Jun 2024 |
$377,883
|
| May 2024 |
$390,617
|
| Apr 2024 |
$374,620
|
| Mar 2024 |
$432,849
|
| Feb 2024 |
$432,849
|
| Jan 2024 |
$432,849
|
| Month | Median Price |
|---|---|
| Jun 2024 |
$762,164
|
| May 2024 |
$816,995
|
| Apr 2024 |
$807,883
|
| Mar 2024 |
$793,125
|
| Feb 2024 |
$793,125
|
| Jan 2024 |
$793,125
|
Household Income
The average household income in Austin, MN grew from $45,519 to $46,923 in the past year. This data is an estimate based upon 9,903 households in Austin, MN . The chart below presents how household income is distributed in Austin, MN in comparison to the revenue allocation amid households nationally.
Property Value
According to data from last year, the average property value in Austin, MN shifted from $98,600 to $99,500 throughout the year. The subsequent graph indicates the share of properties in the given price range in Austin, MN in comparison to the median property value in the same price segment across the country. According to the data, the greatest share of Austin, MN properties falls in the '$100,000 to $124,999' range, which is lower than the most significant median property across the country.
Property Taxes
One of the most important aspects for property owners is the amount of property taxes. This graph shows distribution of property taxes in Austin, MN compared to median property taxes around the country. The prevalent amount of property taxes in Austin, MN equals $800, which is less than the national average.