Bangor, CA, USA apartments for sale
$550,000
$550,000
Available: Right Now
Introducing this custom built2, 748sq ft property that offers something for everyone. Animal enthusiasts will appreciate the large barn. Outdoor lovers can enjoy the local wildlife. Tinkerers will find joy in the separate shop/garage. Indoor comfort ...
$949,000
$949,000
Available: Right Now
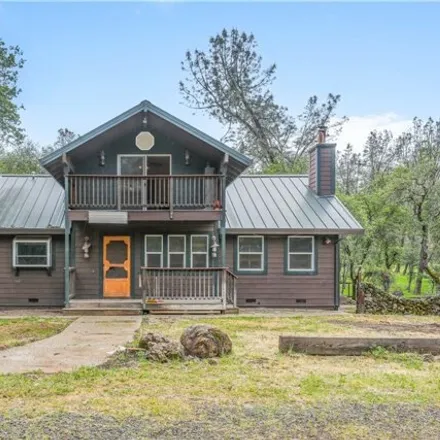
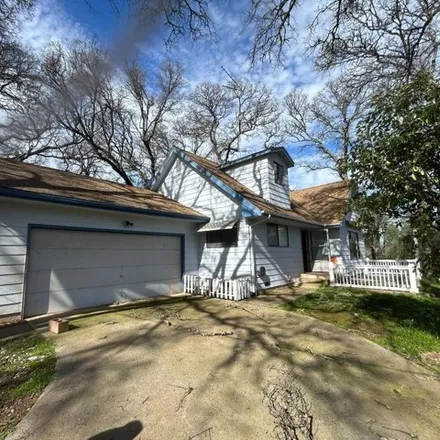
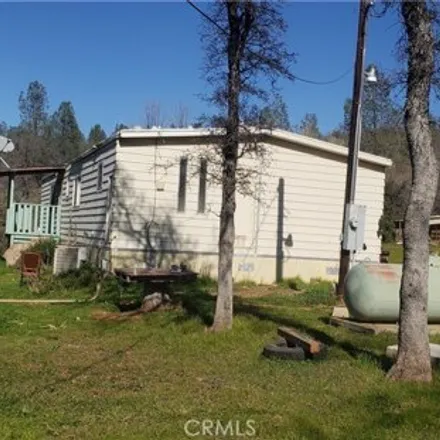
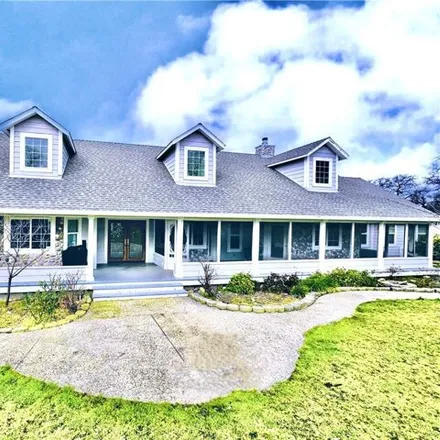
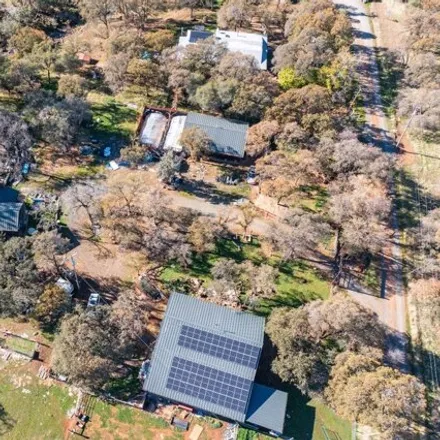
This homestead was owned for 2 generations and only now becoming available for sale. Featuring three houses situated on one APN. Whether you're seeking multigenerational living, rental income opportunities, retreat hosting, or homesteading dreams, th...

$575,000
$575,000
Available: Right Now
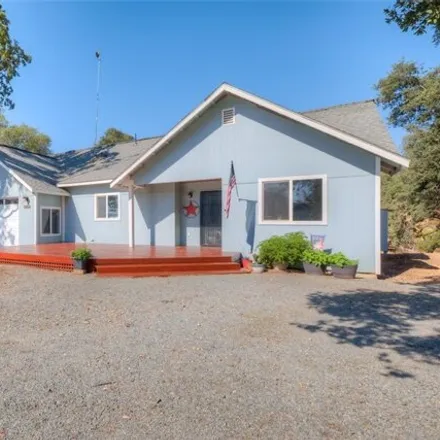
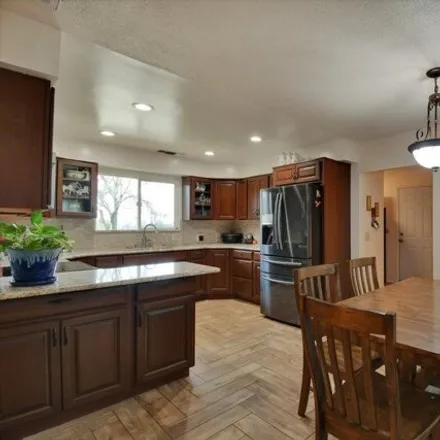
Move in ready ! This Bangor beauty is perfect in every way. Virtually new from the stamped concrete patio to the roof and solar, this home has been meticulously renovated to the highest standards. Sellers have made this home comfortable and su...
$200,000
$200,000
Available: Right Now
5 acres of land with end of the road privacy located in Bangor CA, The 1976 mobile home is placed on a permitted 433 A permanent foundation. It has newer dual pane windows and an open floor plan. Repairs and updating are needed to make it fully funct...
$965,000
$965,000
Available: Right Now
Come view this majestic 3, 960sf custom built home settled at the top of 6.3 acres of your foothill dream! Including a, horse stall, pasture, pool, solar panels, new floors, 700ft Well filtered water and access to agricultural water. The home has a b...
$525,000
$525,000
Available: Right Now
Welcome to the Bangor Mini Ranch, an embodiment of contemporary elegance on a sprawling 4.75 acres of scenic landscape. This meticulously designed haven seamlessly unites modern living with the serene charm of the countryside. Nestled within the quai...

$250,000
$250,000
Available: Right Now
Make your own magic happen on this property! Heavily damage manufactured home on 5.28 acres on Irrigation Ditch, in need of TLC. Property is terraced with great views and mature trees. Call your agent for access and appointment today!...
$649,000
$649,000
Available: Right Now
House for sale in/on/near 36 Woodhill Drive, Butte County, CA 95914, USA. The price for this house is $649,000. This 1530-square-feet 2 bedroom house features 2 bathroom. Contact the agent to schedule an open house....
$549,999
$549,999
Available: Right Now
Embrace country living in this 3-bed, 2-bath updated home on 5.13 acres, perfect for equestrian, gardening, homesteading, and farming enthusiasts. Features include pastures, cross-fencing, RV parking, sheds and a 2 car garage. The master bedroom is a...
Bangor
According to statistics, the population in Bangor, CA amounts to 524, which shows growth 11% compared to the previous year. The median age of the city’s residents is 58. The average household income is $56,250, shifting growth 10% from the past year, and the average property value in Bangor, CA decline -18% to $247,600 throughout the year.
| Population | 524 |
| Median Age | 58.1 |
| Poverty Rate | 9% |
| Household Income | $56,250 |
| Number Of Employees | 210 |
| Median Property Value | $247,600 |
What is the Average Price of Apartments for Sale in Bangor, CA?
| Month | Median Price |
|---|---|
| Apr 2024 |
$306,819
|
| Mar 2024 |
$306,819
|
| Feb 2024 |
$306,819
|
| Jan 2024 |
$306,819
|
| Dec 2023 |
$296,924
|
| Nov 2023 |
$236,414
|
| Month | Median Price |
|---|---|
| Apr 2024 |
$300,241
|
| Mar 2024 |
$300,241
|
| Feb 2024 |
$300,241
|
| Jan 2024 |
$300,241
|
| Dec 2023 |
$295,743
|
| Nov 2023 |
$264,951
|
Household Income
The average household income in Bangor, CA grew from $51,250 to $56,250 in the past year. This data is an estimate based upon 215 households in Bangor, CA . The chart below presents how household income is distributed in Bangor, CA in comparison to the revenue allocation amid households nationally.
Property Value
According to data from last year, the average property value in Bangor, CA shifted from $301,800 to $247,600 throughout the year. The subsequent graph indicates the share of properties in the given price range in Bangor, CA in comparison to the median property value in the same price segment across the country. According to the data, the greatest share of Bangor, CA properties falls in the '$300,000 to $399,999' range, which is higher than the most significant median property across the country.
Rent vs. Own
Property Taxes
One of the most important aspects for property owners is the amount of property taxes. This graph shows distribution of property taxes in Bangor, CA compared to median property taxes around the country. The prevalent amount of property taxes in Bangor, CA equals $2500, which is less than the national average.