Barre, MA, USA apartments for sale
$400,000
$400,000
Available: Right Now
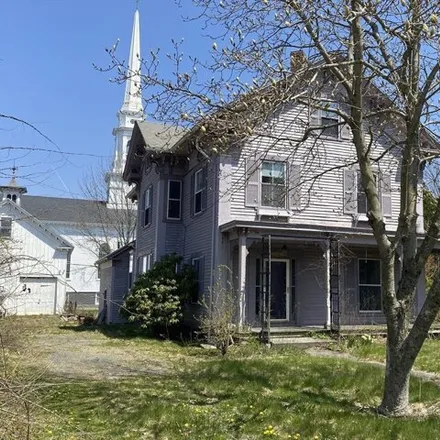
Opportunity Knocks!! The Henry Woods House in the heart of Barre Center is ready for a new owner! Overlooking the picturesque common!! This Quintessential Antique Victorian with beautiful curved front staircase, formal dining room, library, built in ...
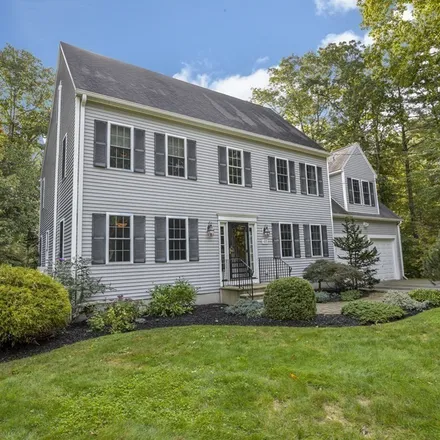
$539,900
$539,900
Available: Right Now
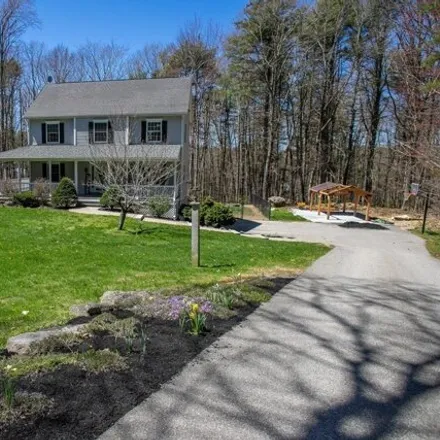
This beautiful home is nestled in a tranquil setting, complete with a wraparound front porch and offers plenty of privacy with a spacious yard and fenced in backyard! The first floor has hardwood flooring throughout and offers a welcoming entryway, a...
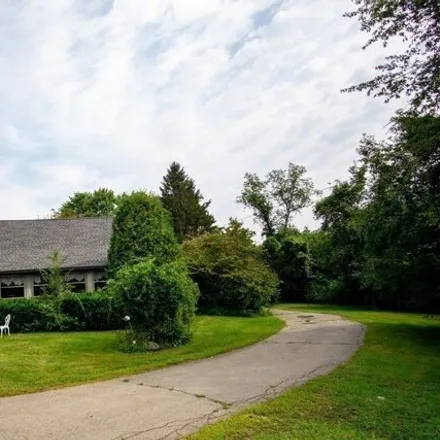
$480,000
$480,000
Available: Right Now
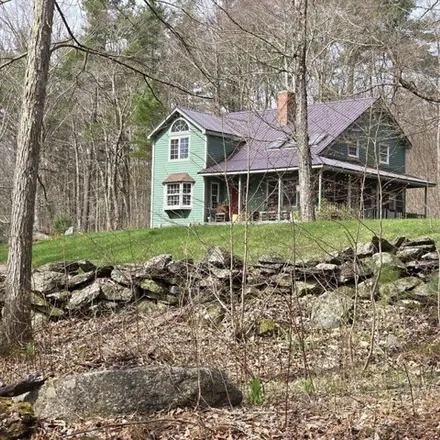
Your getaway in the woods with your own private Coy pond in Foyer! Unique character and privacy best describe this custom built post and beam colonial home with 2.97 acres close to conservation land. Tucked away, yet only 30 minutes from Worcester th...

$350,000
$350,000
Available: Right Now
Bring your Vision to this beautiful circa 1890 church with soaring Bell tower and Clock!. Features are from the Arts and Crafts period with intact Stained Glass Windows. Potential for a Single Family residence with in-home business component, Auction...
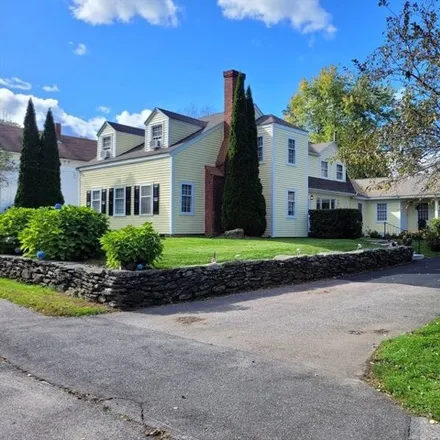
$774,000
$774,000
Available: Right Now
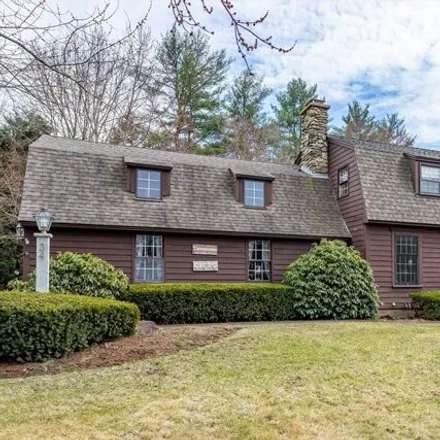
One of a kind, Custom built expanded full Dormered Cape situated on a 2+ acre resort style country retreat! This home is like no other!! Quality craftsmanship and charm at every turn! HW floors, built-ins, custom inlay paneling , slate/ stone entrywa...
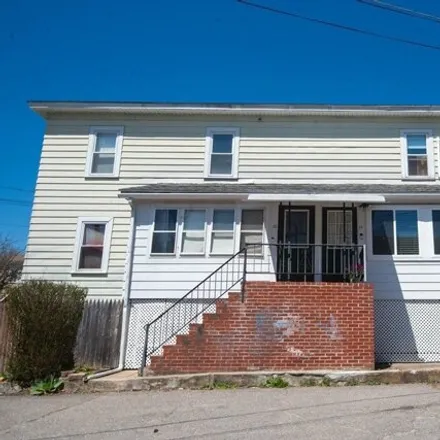
$229,900
$229,900
Available: Right Now
Incredible opportunity own at an Affordable price point and low taxes! Upgrades everywhere! 5 room 2 bedroom 1.5 bath Single family attached style home. Bright finished 4 season porch with mini split (2022) leads to a large open eat in ...
$600,000
$600,000
Available: Right Now
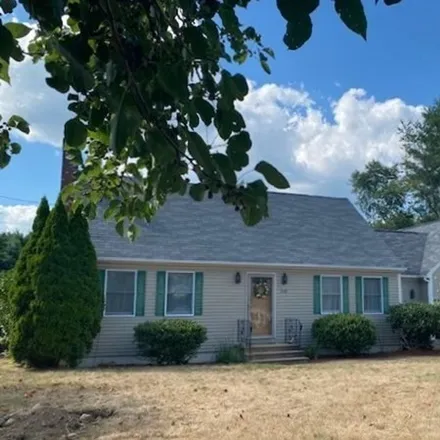
Nestled in the heart of uptown Barre, this captivating antique Cape effortlessly blends modern updates with timeless charm. Boasting 3 to 5 bedrooms, this home welcomes you with a warm embrace from the moment you step inside. Original fireplaces and ...
$850,000
$850,000
Available: Right Now
Experience the charm of this historic commercial building set on 2 acres of prime real estate in Barre. Formerly a beloved teahouse, this property offers a unique opportunity for entrepreneurs and investors alike. Whether you are looking to revive th...
$489,000
$489,000
Available: Right Now
$375,000
$375,000
Available: Right Now
$739,900
$739,900
Available: Right Now
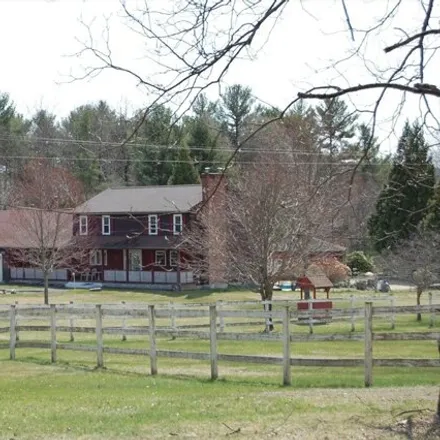
Check out this beautiful horse farm set on 14.94 acres. 4 bedrooms, 3 baths, large family room for family gatherings. First floor has a bedroom with its own bath overlooking the pool and cabana. House has a attached 3 car garage. house has 3 heat sou...
$244,900
$244,900
Available: Right Now
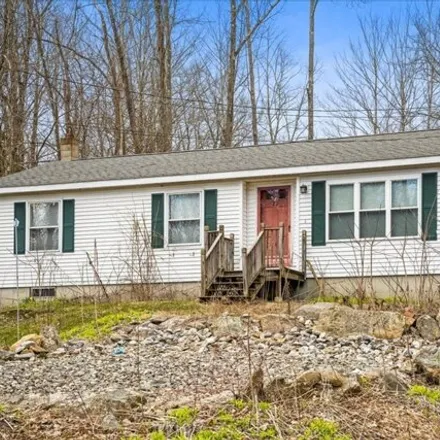
Struggling to find a budget-friendly housing solution that suits your requirements? With some effort, this charming house could become YOUR perfect home! Situated in the picturesque town of Barre, just a stone's throw away from the town common featur...
$365,000
$365,000
Available: Right Now
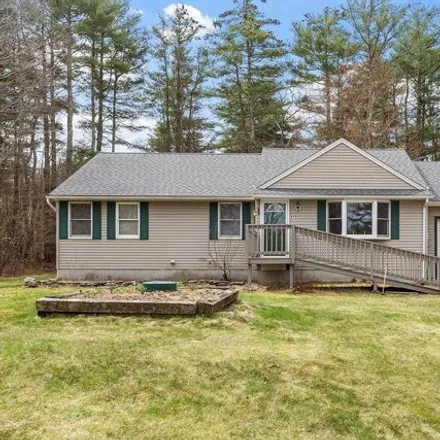
Welcome home to this charming 3 bed, 1 bath ranch with contemporary flair! Embrace the spaciousness of cathedral ceilings and an open concept living, dining, and kitchen area - perfect for gatherings. Step outside through the slider onto the back dec...
Barre
According to statistics, the population in Barre, MA amounts to 1,156, which shows decline -8% compared to the previous year. The median age of the city’s residents is 51. The average household income is $47,602, shifting growth 9% from the past year, and the average property value in Barre, MA growth 11% to $202,300 throughout the year.
| Population | 1,156 |
| Median Age | 50.5 |
| Poverty Rate | 4% |
| Household Income | $47,602 |
| Number Of Employees | 597 |
| Median Property Value | $202,300 |
Household Income
The average household income in Barre, MA grew from $43,605 to $47,602 in the past year. This data is an estimate based upon 502 households in Barre, MA . The chart below presents how household income is distributed in Barre, MA in comparison to the revenue allocation amid households nationally.
Property Value
According to data from last year, the average property value in Barre, MA shifted from $183,000 to $202,300 throughout the year. The subsequent graph indicates the share of properties in the given price range in Barre, MA in comparison to the median property value in the same price segment across the country. According to the data, the greatest share of Barre, MA properties falls in the '$200,000 to $249,999' range, which is lower than the most significant median property across the country.
Rent vs. Own
Property Taxes
One of the most important aspects for property owners is the amount of property taxes. This graph shows distribution of property taxes in Barre, MA compared to median property taxes around the country. The prevalent amount of property taxes in Barre, MA equals $3000, which is less than the national average.