Barry, TX 75102, USA apartments for sale
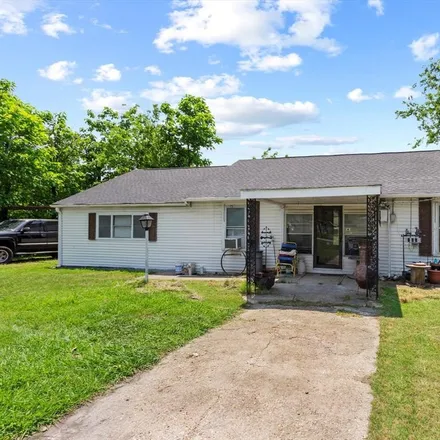
$260,000
$260,000
Available: Right Now
Welcome home! This home gives you the best of both worlds, small town living and easy access to major highways (HWY 22 and 31). This well maintained and spacious home offers an open concept living room, kitchen, and dining area. Kitchen offers granit...
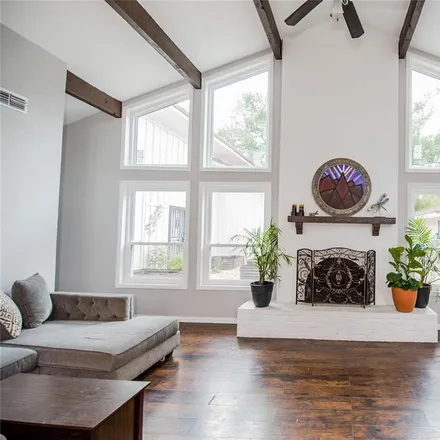
$310,000
$310,000
Available: Right Now
This beautiful home offers a unique open floor plan that provides lots of natural light though the floor to ceiling windows in the living room. Upgrades throughout the home & almost all appliances are only 1 year old!! The main bedroom and bathroom a...
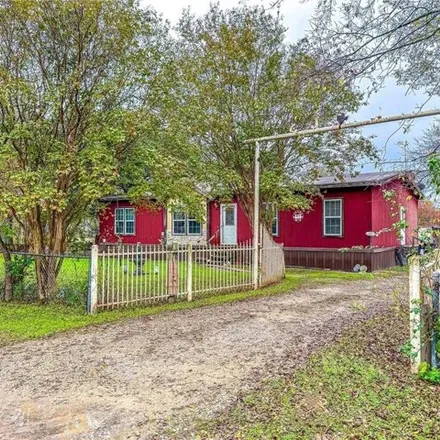
$125,000
$125,000
Available: Right Now
Located just outside of the city; in the peaceful town of Barry, Tx this home is perfect for you to call home! Sitting on half an acre there is plenty of room for you and your guest to enjoy the outdoors. This home has tons of potential to make it yo...
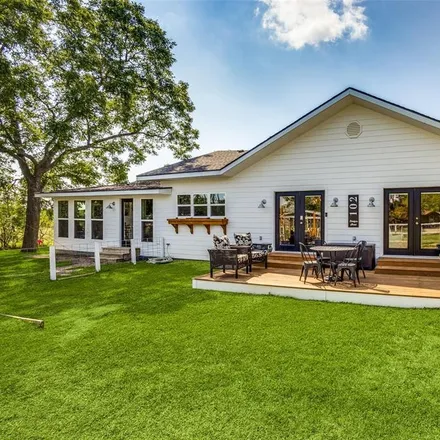
$289,900
$289,900
Available: Right Now
Wow is an understatement! This precious newly rebuilt modern farmhouse should be in Southern Living Magazine. Home totally gutted and rebuilt in 2019. Everything brand new down to the sub flooring, studs, wiring, plumbing, ceilings, windows, doors, r...
Barry
According to statistics, the population in Barry, TX amounts to 268, which shows decline -11% compared to the previous year. The median age of the city’s residents is 39. The average household income is $44,479, shifting decline -10% from the past year, and the average property value in Barry, TX growth 15% to $64,000 throughout the year.
Household Income
The average household income in Barry, TX declined from $49,167 to $44,479 in the past year. This data is an estimate based upon 101 households in Barry, TX . The chart below presents how household income is distributed in Barry, TX in comparison to the revenue allocation amid households nationally.
Property Value
According to data from last year, the average property value in Barry, TX shifted from $55,600 to $64,000 throughout the year. The subsequent graph indicates the share of properties in the given price range in Barry, TX in comparison to the median property value in the same price segment across the country. According to the data, the greatest share of Barry, TX properties falls in the '$70,000 to $79,999' range, which is lower than the most significant median property across the country.
Property Taxes
One of the most important aspects for property owners is the amount of property taxes. This graph shows distribution of property taxes in Barry, TX compared to median property taxes around the country. The prevalent amount of property taxes in Barry, TX equals $1150, which is less than the national average.