Bellerive, MO 63121, USA apartments for sale
$263,000
$263,000
Available: Right Now
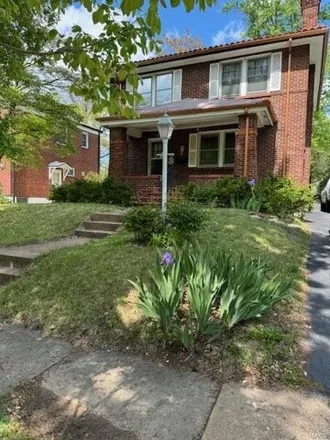
Great Location! Long driveway to this attractive brick home. 5 minute walk to UMSL. Close to restaurants, grocery stores, Churches and entertainment. Very Well maintained! Brick, 2 story home in nice, quiet, peaceful area of Bel-Nor. Already passed O...
Bellerive
According to statistics, the population in Bellerive, MO amounts to 180, which shows n/a% compared to the previous year. The median age of the city’s residents is 60. The average household income is $115,833, shifting n/a% from the past year, and the average property value in Bellerive, MO n/a% to $236,100 throughout the year.
Household Income
The average household income in Bellerive, MO grew from $n/a to $115,833 in the past year. This data is an estimate based upon n/a households in Bellerive, MO . The chart below presents how household income is distributed in Bellerive, MO in comparison to the revenue allocation amid households nationally.
Property Value
According to data from last year, the average property value in Bellerive, MO shifted from $n/a to $236,100 throughout the year. The subsequent graph indicates the share of properties in the given price range in Bellerive, MO in comparison to the median property value in the same price segment across the country. According to the data, the greatest share of Bellerive, MO properties falls in the 'n/a' range, which is lower than the most significant median property across the country.
Property Taxes
One of the most important aspects for property owners is the amount of property taxes. This graph shows distribution of property taxes in Bellerive, MO compared to median property taxes around the country. The prevalent amount of property taxes in Bellerive, MO equals $n/a, which is less than the national average.