Bellwood, VA, USA apartments for sale

$276,000
$276,000
Available: Right Now
Welcome to this property, it sounds absolutely enchanting! The interior boasts a neutral color paint scheme, a timeless choice bound to complement any decoration style you choose. The kitchen, with its accent backsplash, seems like the heart of the h...
$299,500
$299,500
Available: Right Now
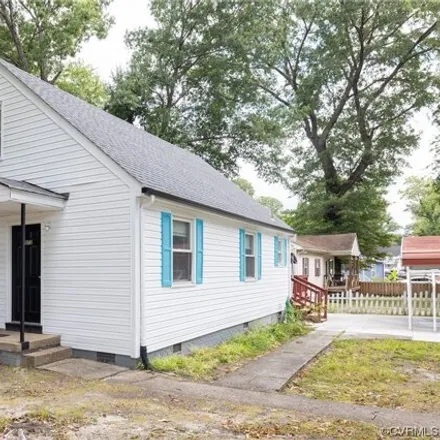
Charming 3 bedroom 2 bathroom cape (look and feel of the beach) in quite neighborhood of Chesterfield County conveniently located just minutes from Chippenham Pkwy and Downtown. This home features a newer roof, newer tankless water heater, ceramic ti...

$250,000
$250,000
Available: Right Now
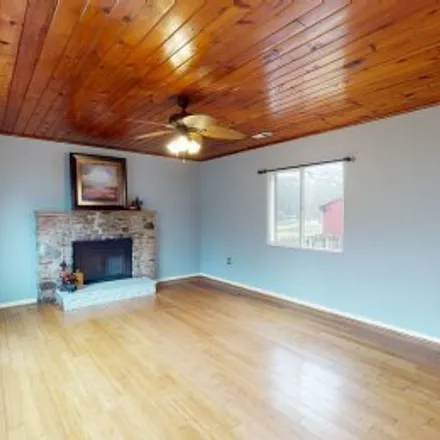
Calling all investors ! South Richmond - Mainly One Level Living Home with Unfinished Walkout Basement! This Home is in need of cosmetic updates/repairs with TONS of potential for more Finished Square Footage! Open Concept Living Area with Har...
$220,000
$220,000
Available: Right Now
Apartment for sale in/on/near 9001 Carswell Street, Richmond. The price for this apartment is $220,000. This 932-square-feet 2 bedroom apartment features 1 bathroom. Contact the agent to schedule an open house....
$193,000
$193,000
Available: Right Now
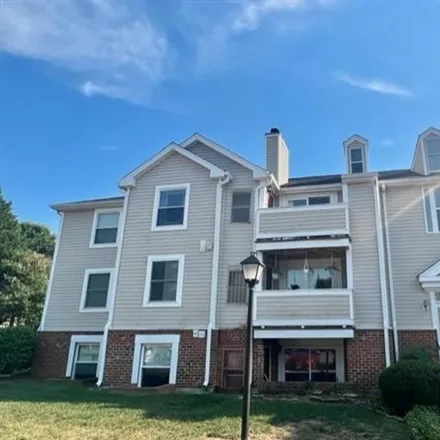
Lower level unit in desirable & convenient Short Pump location. Two bedrooms & two full baths, galley kitchen with all appliances and pantry with look through to eat-in dining area. Spacious family room with fireplace, coat closet and access to cover...

$265,000
$265,000
Available: Right Now
Investment opportunity ! DUPLEX Just minutes from interstate I95 and 895 with quick access to 301 and Chippenham Parkway. This home is aDUPLEXand each unit features two bedrooms, one bath, kitchen and family room. Each unit has its own private...

$349,900
$349,900
Available: Right Now
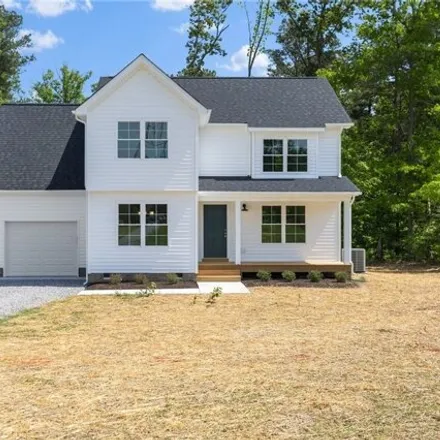
Welcome to this charming home, perfectly situated on a tranquil cul-de-sac lot. Boasting 4 bedrooms and 2 baths, this residence features lovely wood floors that shine throughout the first level. The eat-in kitchen offers gas cooking, granite countert...

$330,000
$330,000
Available: Right Now
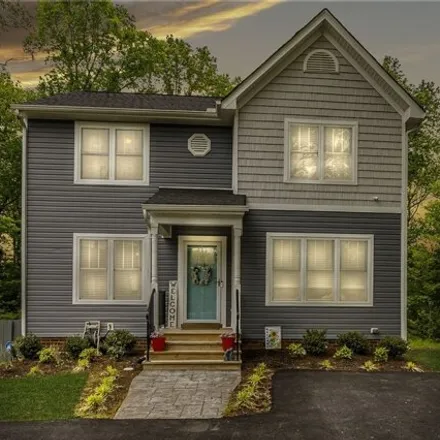
Welcome to 10134 Brandywine Ave. This Charming home was Built in 2020. Features 4 Bedrooms. Home boasts lots of natural light. The front Porch is inviting and ready for your rocking chairs! The kitchen boasts a charming rock designed backsplash. In t...

$219,900
$219,900
Available: Right Now
Nice price reduction. Check out this 3 bedroom Rancher on large, level lot in a great area of Chesterfield county. Enjoy the full country front porch and two large sheds. Fabulous, private backyard that is very spacious. Very affordable, clean home i...
$220,000
$220,000
Available: Right Now
This charming cape is ready for move in immediately! Upon walking in the front door you will find a freshly painted family room with hardwood floors that opens up to the dining room. The kitchen offers stainless steel appliances, backsplash, laminate...
$199,950
$199,950
Available: Right Now
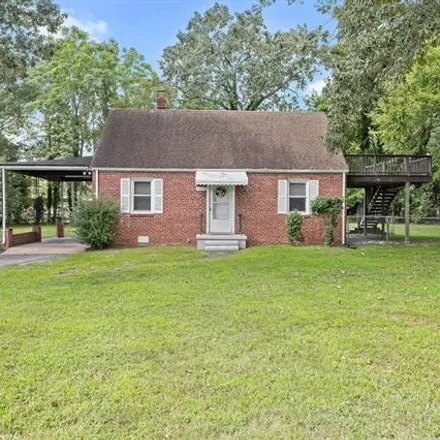
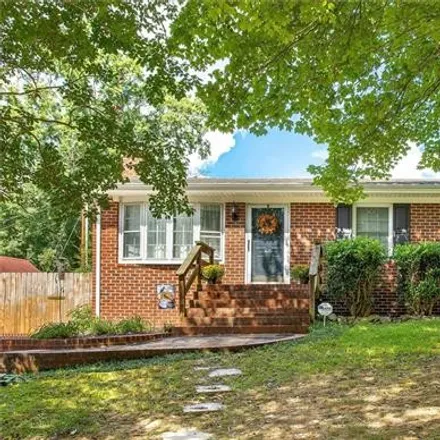
Take a look at this beautiful brick rancher with a fully finished walk-out basement. There are two bedrooms on the first floor, each with their own full, private bathroom! You'll love the open living room complete with a stone, gas log fireplace and ...

$330,000
$330,000
Available: Right Now
Welcome to this adorable, one of a kind, 4 bedroom, 3 full bath Rancher in the Quail Oaks Neighborhood. This fully renovated home boasts a pop of color on the front doors to brighten your day but overall a neutral color paint scheme, a timeless choic...
$341,000
$341,000
Available: Right Now
Step into the inviting ambiance of 10207 Brightwood Ave! This craftsman-style gem, constructed in 2018, offers a blend of contemporary comfort and timeless appeal. Boasting 3 bedrooms and 2 1/2 bathrooms, this home is brimming with turn-key features,...
$379,950
$379,950
Available: Right Now
This Brand-new home built by Ray Williams Construction is complete and ready for you to move in. Owner financing is available with LOW closing costs for qualified buyers. Luxury vinyl plank flooring throughout the first floor is great for easy...
Bellwood
According to statistics, the population in Bellwood, VA amounts to 6,504, which shows growth 7% compared to the previous year. The median age of the city’s residents is 34. The average household income is $41,552, shifting growth 6% from the past year, and the average property value in Bellwood, VA growth 2% to $136,500 throughout the year.
| Population | 6,504 |
| Median Age | 33.9 |
| Poverty Rate | 20% |
| Household Income | $41,552 |
| Number Of Employees | 2,970 |
| Median Property Value | $136,500 |
Household Income
The average household income in Bellwood, VA grew from $39,213 to $41,552 in the past year. This data is an estimate based upon 2,440 households in Bellwood, VA . The chart below presents how household income is distributed in Bellwood, VA in comparison to the revenue allocation amid households nationally.
Property Value
According to data from last year, the average property value in Bellwood, VA shifted from $133,300 to $136,500 throughout the year. The subsequent graph indicates the share of properties in the given price range in Bellwood, VA in comparison to the median property value in the same price segment across the country. According to the data, the greatest share of Bellwood, VA properties falls in the '$125,000 to $149,999' range, which is lower than the most significant median property across the country.
Rent vs. Own
Property Taxes
One of the most important aspects for property owners is the amount of property taxes. This graph shows distribution of property taxes in Bellwood, VA compared to median property taxes around the country. The prevalent amount of property taxes in Bellwood, VA equals $1150, which is less than the national average.