Belwood, NC, USA apartments for sale
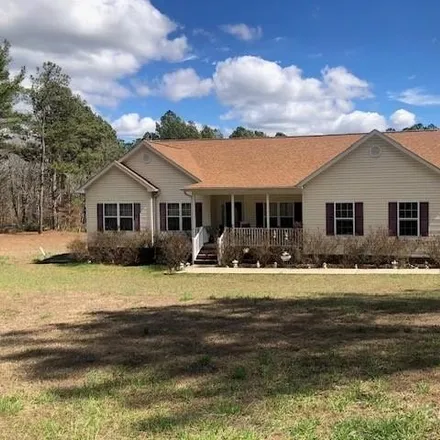
$439,900
$439,900
Available: Right Now
This home was built in 2017 and features an open split bedroom floor plan. The ceilings are 9 foot approximately. As you enter you will find a space for living or office plus dining and it opens to a spacious family room and kitchen with breakfast. T...
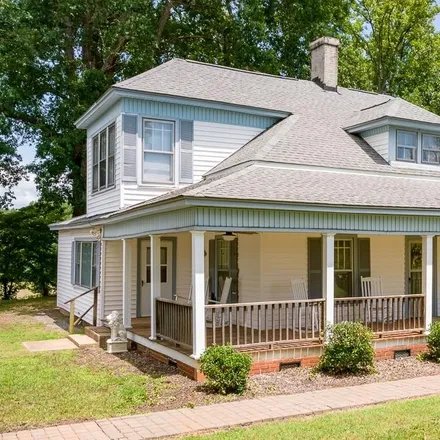
$285,000
$285,000
Available: Right Now
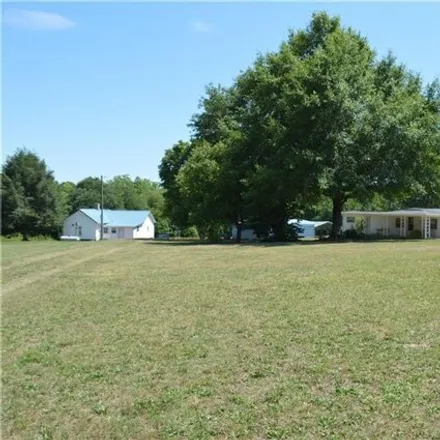
$350,000
$350,000
Available: Right Now
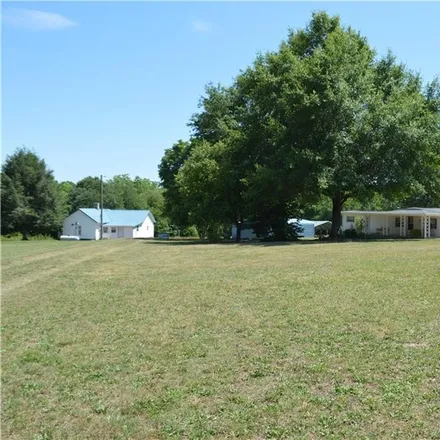
$265,000
$265,000
Available: Right Now
Looking for a quiet country setting? The opportunity has just knocked on your front door! This is a combined sale of two homesites with approximately 4.97acres. Parcel numbers36178, 36147.1bedroom 1bath stick built home, single wide Mobile home, barn...
Belwood
According to statistics, the population in Belwood, NC amounts to 934, which shows decline -4% compared to the previous year. The median age of the city’s residents is 39. The average household income is $41,205, shifting growth 5% from the past year, and the average property value in Belwood, NC decline -1% to $92,200 throughout the year.
| Population | 934 |
| Median Age | 39.2 |
| Poverty Rate | 15% |
| Household Income | $41,205 |
| Number Of Employees | 386 |
| Median Property Value | $92,200 |
Household Income
The average household income in Belwood, NC grew from $39,408 to $41,205 in the past year. This data is an estimate based upon 365 households in Belwood, NC . The chart below presents how household income is distributed in Belwood, NC in comparison to the revenue allocation amid households nationally.
Property Value
According to data from last year, the average property value in Belwood, NC shifted from $93,200 to $92,200 throughout the year. The subsequent graph indicates the share of properties in the given price range in Belwood, NC in comparison to the median property value in the same price segment across the country. According to the data, the greatest share of Belwood, NC properties falls in the '$100,000 to $124,999' range, which is lower than the most significant median property across the country.
Rent vs. Own
Property Taxes
One of the most important aspects for property owners is the amount of property taxes. This graph shows distribution of property taxes in Belwood, NC compared to median property taxes around the country. The prevalent amount of property taxes in Belwood, NC equals $800, which is less than the national average.