Bertram, TX 78605, USA apartments for sale
$359,000
$359,000
Available: Right Now
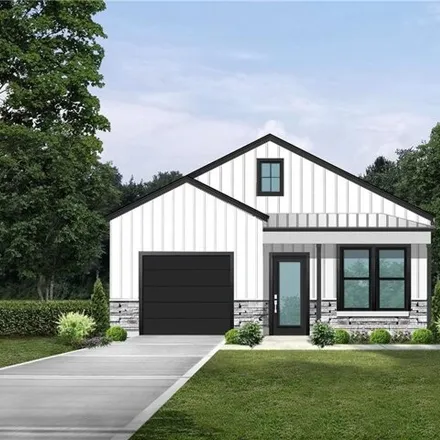
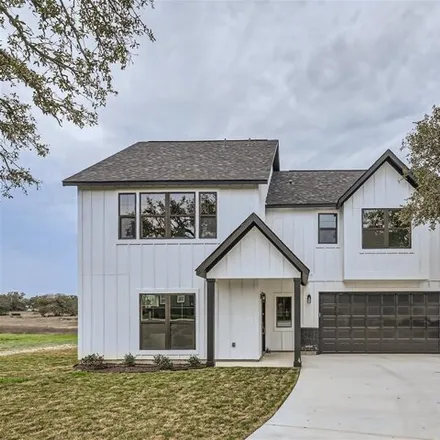
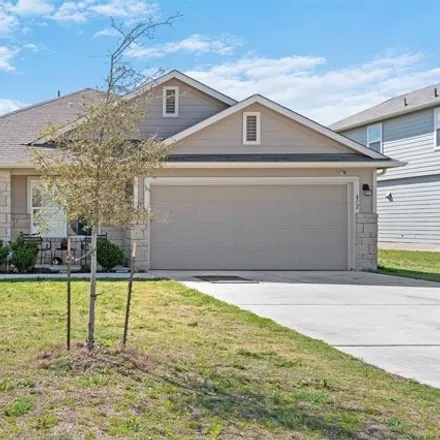
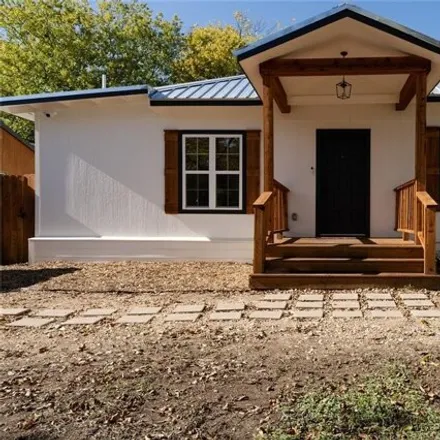
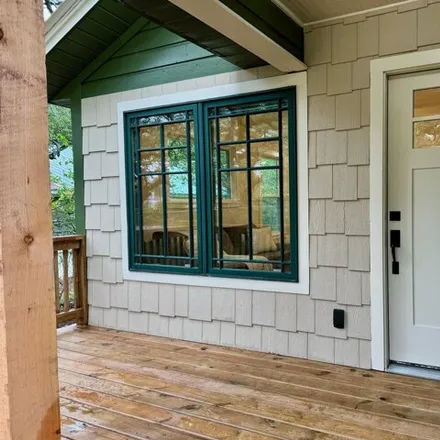
Welcome to your dream home in the heart of Bertram! This brand-new 3-bedroom, 2-bath barndominium is set to be completed at the end of February and is now on the market for$359, 000.Key Features: Spacious 3 bedrooms, 2 bathrooms, Inviting open floor ...
$370,000
$370,000
Available: Right Now
Welcome to this charming well-maintained residence nestled in the heart of Bertram, TX! This single-story home offers1, 873square feet of space filled with natural light. With 4 bedrooms and 2 bathrooms awaiting your personal touch, this home is eage...
$349,000
$349,000
Available: Right Now
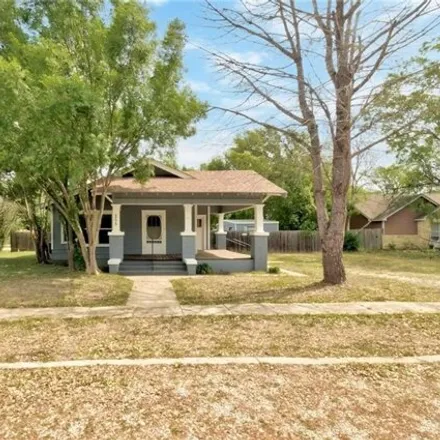
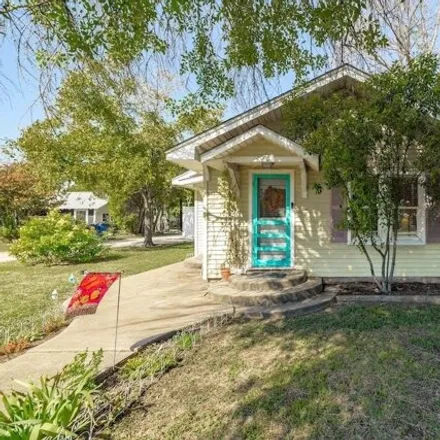
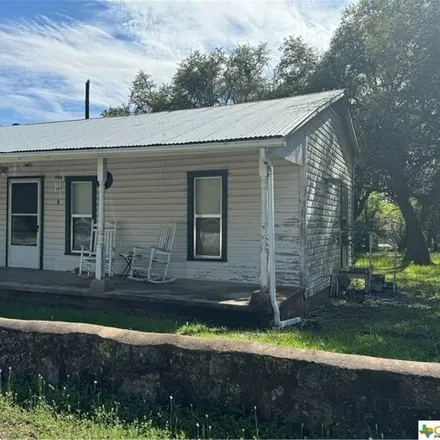
Charming Craftsman period style home in the heart of old Bertram. Recently remodeled with modern amenities and keeping many original features in the house intact. Beautiful original molding and trim. Most of the original hardwood floors and wall pane...
$339,000
$339,000
Available: Right Now
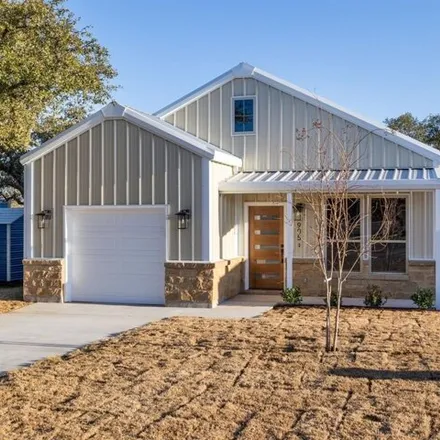
New construction - completed and ready for immediate move-in. This 3 Bedroom/2 Bathroom with garage, energy efficient home that uses sustainable exterior materials will help with the homeowners' maintenance costs. The stylish design will stand...
$424,999
$424,999
Available: Right Now
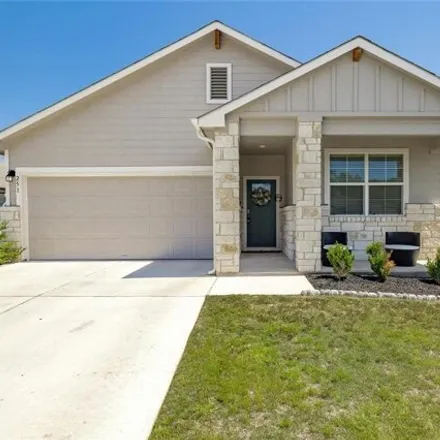
Welcome to your dream home in the heart of Bertram! This meticulously crafted residence boasts a prime location within walking distance to downtown Bertram, Bertram Elementary, and the local baseball fields, making it a perfect haven for families and...
$369,999
$369,999
Available: Right Now
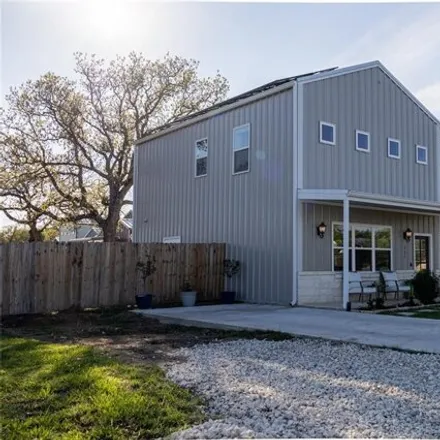
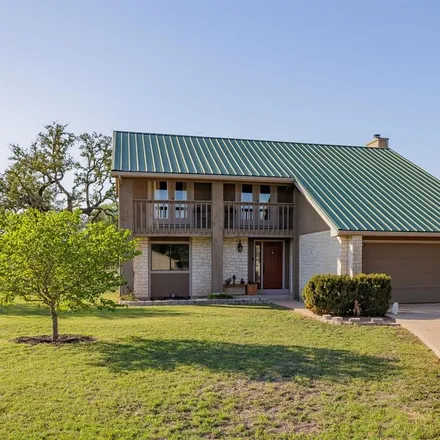
Welcome to 227 Western Ave, a beautiful 2 story well built barndominium on a steel frame structure with spray foam insulation, in the heart of the thriving community in Bertram, Texas. This meticulously maintained home offers a perfect blend of comfo...
$305,000
$305,000
Available: Right Now
Welcome to 535 Live Oak Dr, nestled in the charming town of Bertram. This delightful three-bedroom, two-bathroom home sits on a spacious 0.32-acre lot with beautiful trees. Inside, the home offers a large living room with vaulted ceilings, new floori...
$325,000
$325,000
Available: Right Now
Charming 3 Bedroom Home in Idyllic Bertram Discover the perfect blend of comfort and elegance in this stunning 3 bedroom, 2 bathroom residence, nestled on an expansive lot of over 1/2 acre in the quaint town of Bertram. Designed with modern living in...
$250,000
$250,000
Available: Right Now
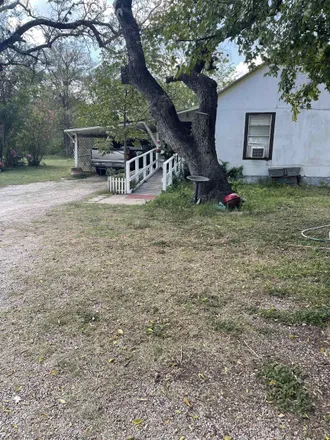
BOM - repaired foundation, electrical, plumbing, and honey do's! This charming 1956 farmhouse on a beautiful third of an acre is in the heart of Bertram. Sitting on a corner lot w/tons of windows allowing the natural unlight to flow in and original l...
$299,900
$299,900
Available: Right Now
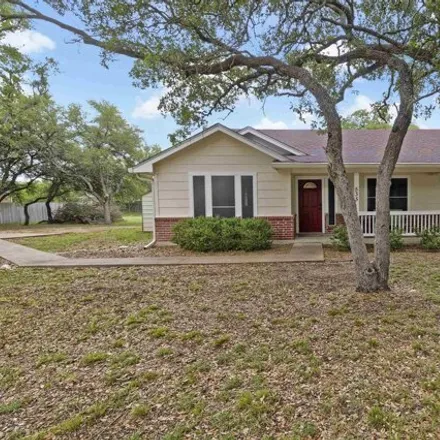
Check out this charming home located at 240 Western Avenue in Bertram, Tx. This one owner home is a 3 bedroom 2 bathroom house at just under 1200 square feet. Located in a quiet community just off ofFM 243and moments from downtown Bertram. With the c...
$284,995
$284,995
Available: Right Now
Come check out an inviting slice of Texas living! With its proximity to downtown Bertram and its charming small-town atmosphere, it offers both convenience and a sense of community. The layout of the home seems well-designed, with the open floor plan...
$370,000
$370,000
Available: Right Now
498 Dove Trail is where farm house CHARM meets beautiful modern design. From the red accent doors to the vintage soaker tub this home is full of surprises. There are so many features that will make you smile: unique lighting, granite countertops, sub...
$369,900
$369,900
Available: Right Now
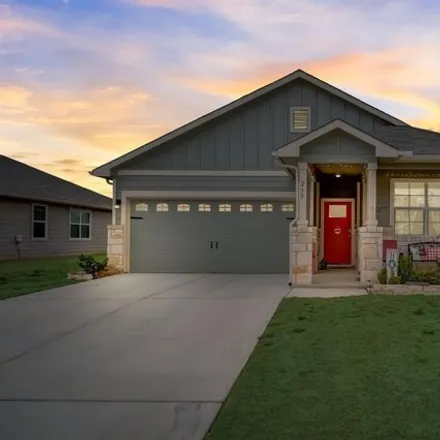
Welcome to your spacious 4-bedroom home with a versatile flex space, crafted in 2020 and free from HOA restrictions. Bright and inviting with crisp white walls, the kitchen dazzles with elegant granite countertops, perfect for both everyday meals and...
$415,000
$415,000
Available: Right Now
$850,000
$850,000
Available: Right Now
$375,000
$375,000
Available: Right Now
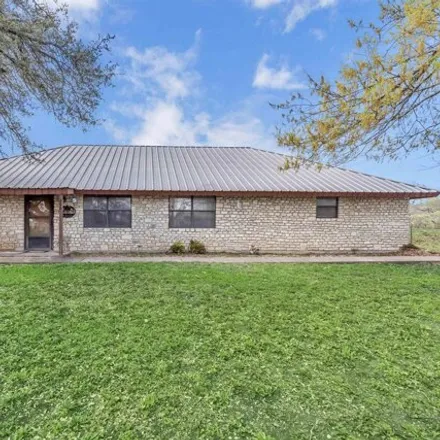
Great home in Bertram, TX with open floorplan and mature trees. Three bedrooms, Two full baths, high and coffered ceilings throughout with wood floors....
$195,000
$195,000
Available: Right Now
$87,500
$87,500
Available: Right Now
$290,950
$290,950
Available: Right Now
Charming 2-Bedroom, 2-Bath Rock Home on Corner Lot in Bertram, Texas Discover the epitome of cozy living in this charming 2-bedroom, 2-bath rock home situated on a corner lot in the heart of Bertram, Texas. Boasting a delightful brick exterior and a ...
$300,000
$300,000
Available: Right Now
Renovated 3-bed, 2-bath home with updated amenities including quartz countertops, windows, wainscoting, SPC flooring, freshly paintedinside and out and metal roof installed 2022. With a fully fenced backyard on a tree covered corner lot theres ample ...
$300,000
$300,000
Available: Right Now
Craftsman-style home was extensively renovated with 3 bedrooms, 2 full bathrooms, and an open-concept living space. The stunning new kitchen features new white shaker cabinets, a beautiful backsplash with floating shelves, natural gas stove and all s...
$359,000
$359,000
Available: Right Now
Cozy meets a thoughtfully designed layout in this gently lived-in 4-bedroom, 2-bathroom home. Boasting a generous1, 855sq ft of living space and an open floor plan with a freshly painted entryway, kitchen, and dining area, this property offers comfor...
$150,000
$150,000
Available: Right Now
Welcome to your charming farmhouse retreat nestled on a spacious corner lot. This 1 bedroom 1 bath cozy home boasts old-world charm with modern amenities, offering a tranquil living experience. Old charm with solid wood floors and shiplap ceilings cr...
Bertram
According to statistics, the population in Bertram, TX amounts to 1,836, which shows growth 22% compared to the previous year. The median age of the city’s residents is 30. The average household income is $55,694, shifting growth 8% from the past year, and the average property value in Bertram, TX growth 1% to $118,300 throughout the year.
Household Income
The average household income in Bertram, TX grew from $51,607 to $55,694 in the past year. This data is an estimate based upon 518 households in Bertram, TX . The chart below presents how household income is distributed in Bertram, TX in comparison to the revenue allocation amid households nationally.
Property Value
According to data from last year, the average property value in Bertram, TX shifted from $117,000 to $118,300 throughout the year. The subsequent graph indicates the share of properties in the given price range in Bertram, TX in comparison to the median property value in the same price segment across the country. According to the data, the greatest share of Bertram, TX properties falls in the '$100,000 to $124,999' range, which is lower than the most significant median property across the country.
Property Taxes
One of the most important aspects for property owners is the amount of property taxes. This graph shows distribution of property taxes in Bertram, TX compared to median property taxes around the country. The prevalent amount of property taxes in Bertram, TX equals $1150, which is less than the national average.