Bigelow, AR 72016, USA apartments for sale
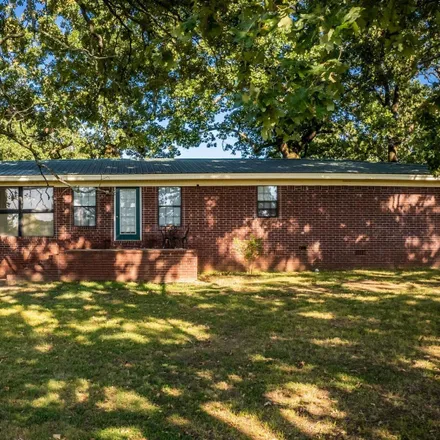
$275,000
$275,000
Available: Right Now
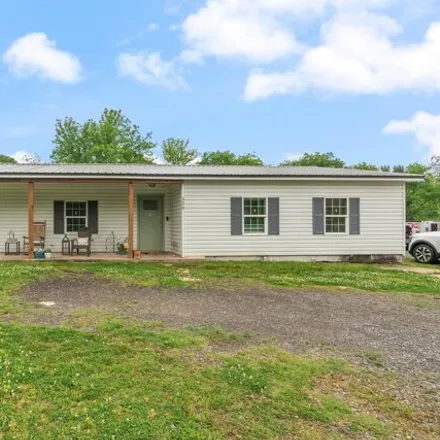
$199,900
$199,900
Available: Right Now
Welcome to this updated, country-living charmer located just 15 minutes from Conway! Featuring an abundance of recent modern upgrades, it's the perfect place to call home! HVAC, roof, hot water heater, flooring, windows, lighting, cabinets, appliance...
Bigelow
According to statistics, the population in Bigelow, AR amounts to 289, which shows decline -23% compared to the previous year. The median age of the city’s residents is 29. The average household income is $46,250, shifting growth 12% from the past year, and the average property value in Bigelow, AR decline -8% to $55,400 throughout the year.
Household Income
The average household income in Bigelow, AR grew from $41,250 to $46,250 in the past year. This data is an estimate based upon 72 households in Bigelow, AR . The chart below presents how household income is distributed in Bigelow, AR in comparison to the revenue allocation amid households nationally.
Property Value
According to data from last year, the average property value in Bigelow, AR shifted from $60,000 to $55,400 throughout the year. The subsequent graph indicates the share of properties in the given price range in Bigelow, AR in comparison to the median property value in the same price segment across the country. According to the data, the greatest share of Bigelow, AR properties falls in the '$40,000 to $49,999' range, which is higher than the most significant median property across the country.
Property Taxes
One of the most important aspects for property owners is the amount of property taxes. This graph shows distribution of property taxes in Bigelow, AR compared to median property taxes around the country. The prevalent amount of property taxes in Bigelow, AR equals $800, which is less than the national average.