Black Jack, MO 63033, USA apartments for sale
$199,900
$199,900
Available: Right Now
$299,900
$299,900
Available: Right Now
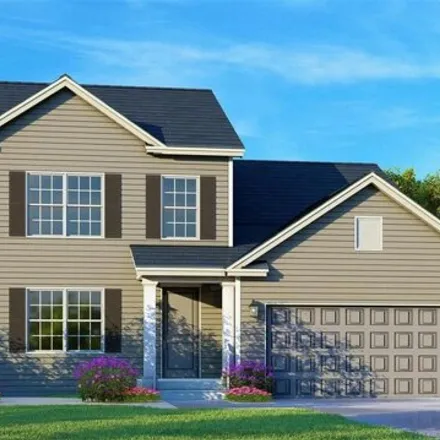
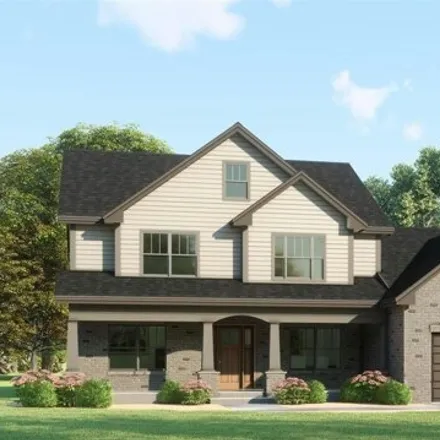
Now Open! To Be Built Home ready to personalize into your dream home! Base price andPHOTOSare for4BR, 2.5BABethpage Two Story. Pricing will vary depending on various interior/exterior selections. This beautiful home opens to a living rm/office...

$289,900
$289,900
Available: Right Now
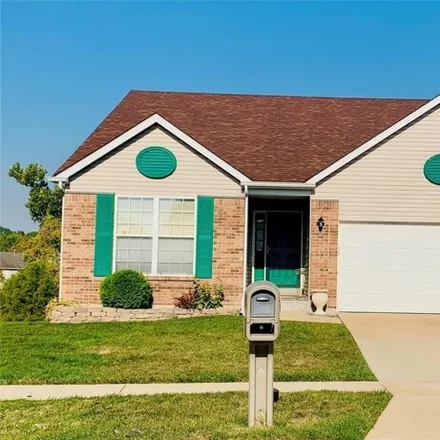
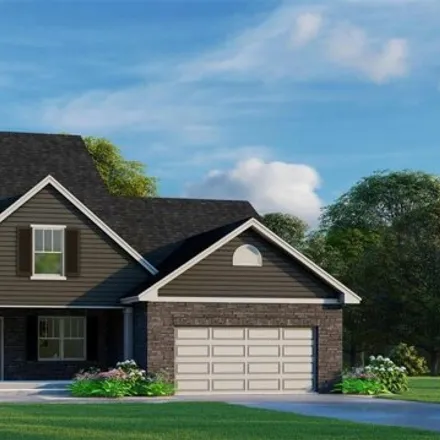
To Be Built Home ready to personalize into your dream home! Base price andPHOTOSare for 3br, 2ba hazeltine Ranch. Pricing will vary depending on various interior/exterior selections. Featuring oversized great room w/available vaulted ce...
$299,000
$299,000
Available: Right Now
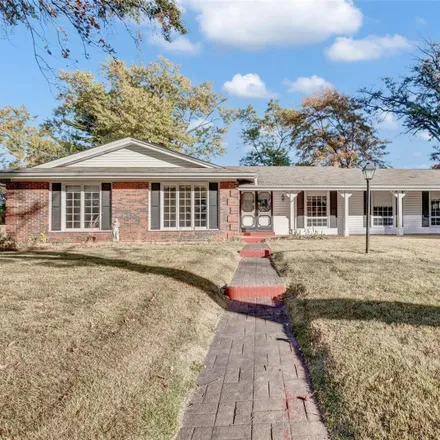
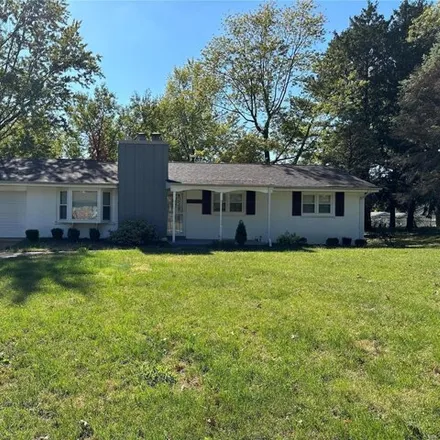
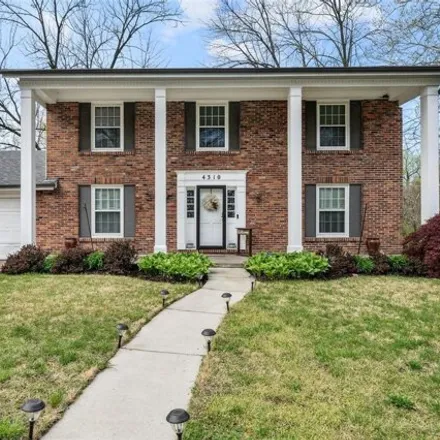
WELCOMEto this wonderful ranch style home in sought after Richmond Place subdivision. Boasting 5 bedrooms and 3 full baths, main floor master suite, hardwood floors in the eat-in-kitchen, plus a huge deck that can be opened from the kitchen area or t...
$210,000
$210,000
Available: Right Now
Welcome home to this charming property with a cozy fireplace perfect for those chilly evenings. The natural color palette throughout the home creates a serene atmosphere, complemented by a nice backsplash in the kitchen. The flexible living space off...
$214,900
$214,900
Available: Right Now
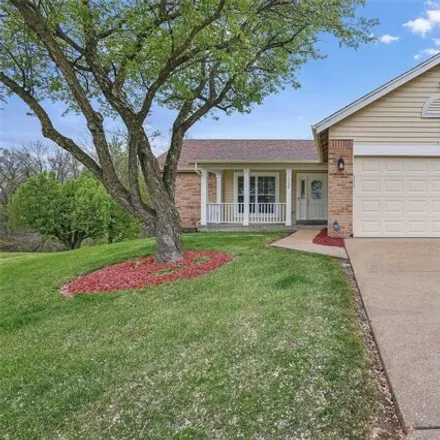
Welcome home !!! Amazing property waiting for new owners !!! Primarily Brick Ranch Style home welcomes you with a covered front porch. You will love the open layout of the living room with fireplace and bay/bow window that flows into th...
$370,000
$370,000
Available: Right Now
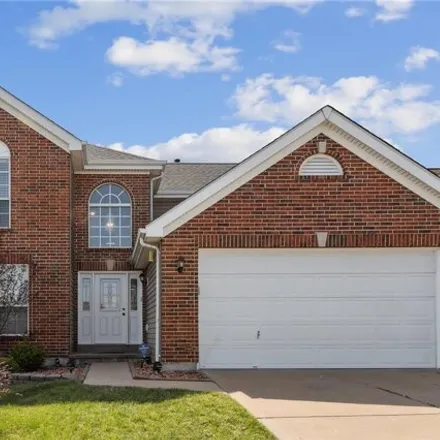
Incredible opportunity in the desirable Behlmann Farms Subdivision! Initially welcome your family and friends to this cozy home with beautiful landscaping and enter the 2 story foyer which is open and inviting. The first level offers Beauti...
$334,900
$334,900
Available: Right Now
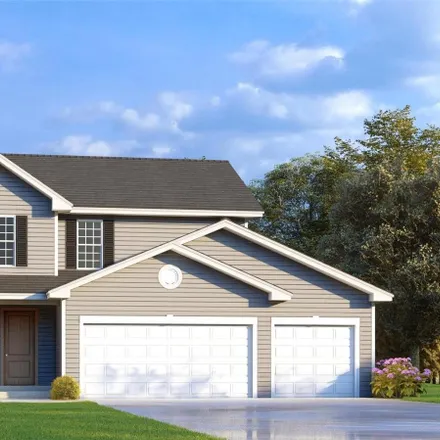
Now Open! To Be Built Home ready to personalize into your dream home! Base price andPHOTOSare for4BR, 2.5BASawgrass 1 Story. Pricing will vary depending on various interior/exterior selections. Highlight of this floor plan is the two story gre...
$334,900
$334,900
Available: Right Now
Now Open! To Be Built Home ready to personalize into your dream home! Base price andPHOTOSare for4BR, 2.5BASawgrass 1 Story. Pricing will vary depending on various interior/exterior selections. Highlight of this floor plan is the two story gre...
$300,000
$300,000
Available: Right Now
Step into your beautiful new home nestled in a welcoming neighborhood. This spacious 4 bedroom, 3.5 bathroom home is perfect for family living or entertaining guests. The main floor offers a cozy living area with a wood-burning fireplace and convenie...
$239,900
$239,900
Available: Right Now
$440,000
$440,000
Available: Right Now
Rare Opportunity in the exclusive Estates at Behlmann Farms! This highly maintained 4bd, 3 full bath atrium ranch with 4500+ sqft of living space sits at the end of a quiet cul-de-sac. The open floorplan w/updated wood floors, vaulted ceilings, two f...
$400,000
$400,000
Available: Right Now
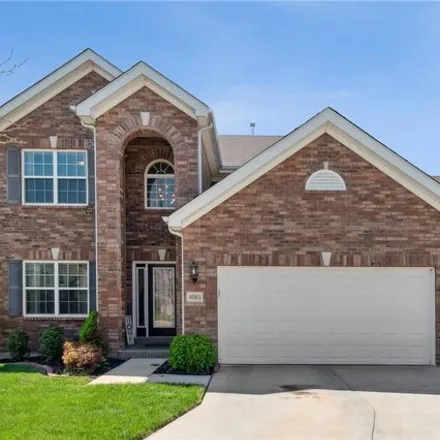
Discover your dream home at 4583 Behlmann Grove Place, an exquisite two-story residence situated in the prestigious Estates at Behlmann Farm subdivision! This stunning semi-open floor plan features high ceilings, abundant natural light, and a thought...
$106,000
$106,000
Available: Right Now
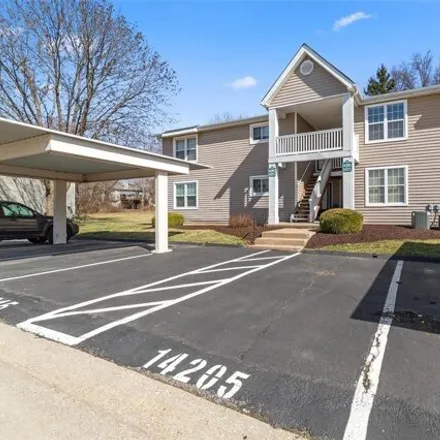
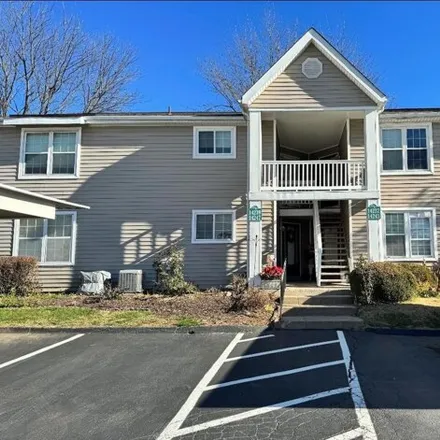
WELCOMEto your new home! This well-maintained 2nd-floor condo offers an open floor plan and lots of natural light that backs to a wooded area. Located in the heart of Florissant it is perfect for first-time homebuyers, downsizers, or anyone seeking a...
$193,000
$193,000
Available: Right Now
$200,000
$200,000
Available: Right Now
$124,500
$124,500
Available: Right Now
$274,900
$274,900
Available: Right Now
$325,000
$325,000
Available: Right Now
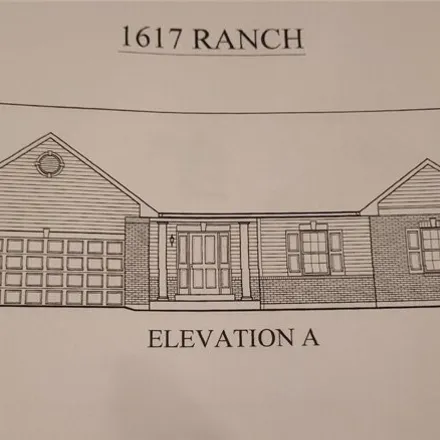
New Construction TBB Lot is located on a Cul-de-sac. Several plans are available. 3 bed 2 bath plans starting at 325k for standard features and materials. Bring your ideas to appease your new home with upgrades....
$518,000
$518,000
Available: Right Now
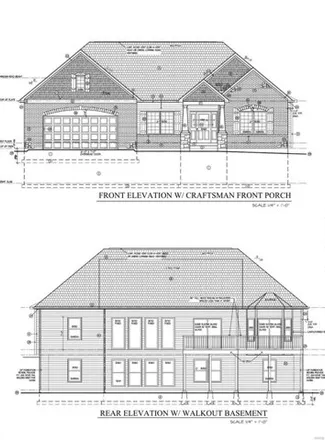
TBB Builder has plans ready to go for this 3000 sqft Atrium Ranch. Partially finished basement with bedroom and full bath. Price reflects builder standard finishes. Upgrade to the finishes you prefer adds to builders price....
$165,000
$165,000
Available: Right Now
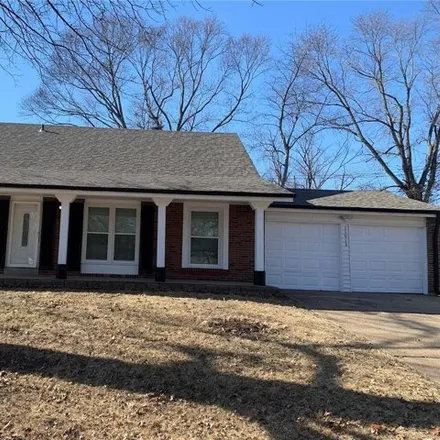
Seller to do no repairs. Selling As-Is. This home is in great condition, features a finished basement with an additional room that could be used for sleeping, office, playroom or gym....
$199,900
$199,900
Available: Right Now
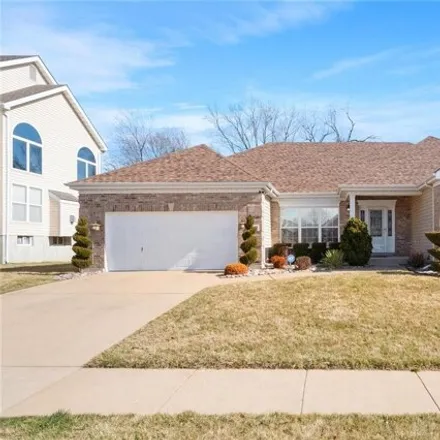
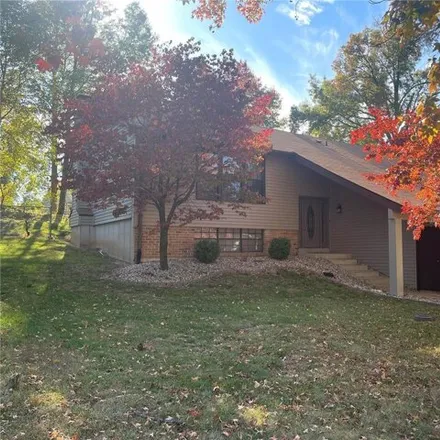
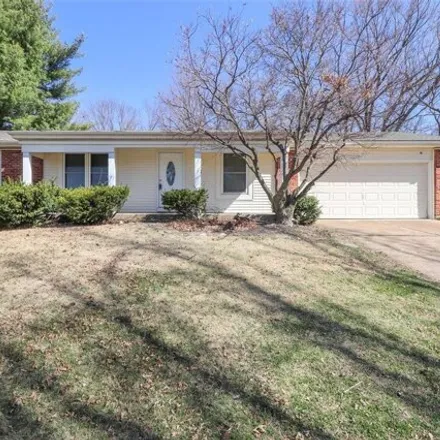
Nestled in a picturesque cul-de-sac, this exquisite atrium ranch house offers an idyllic setting with a backdrop of lush, mature trees. Boasting 3 bedrooms, 2 1/2baths, and a 2-car garage, this home is designed for both comfort and style. A cozy wood...
$215,000
$215,000
Available: Right Now
Fee the warmth in this lovingly maintained split foyer, multi-level home. Newer carpeting throughout the main level. Vaulted and spacious living room. Covered and fenced patio, perfect for your morning coffee or entertaining friends. Recreational roo...
$160,000
$160,000
Available: Right Now
Welcome to the immaculate Seven Hills subdivision. 11707Marcinus awaits your finishing touches to restore her back to glory! Take a walk through the courtyard entry and then into the foyer. From there, youre pick! How about heading through the eat-in...
$239,900
$239,900
Available: Right Now
Newly renovated! 4 beds 2 full baths with close to 1900 sq ft! Feature include brand new kitchen with granite countertop, brand new stainless steel appliances, new flooring thru-out! All new windows thru-out (including basement windows are new!), new...
$189,900
$189,900
Available: Right Now
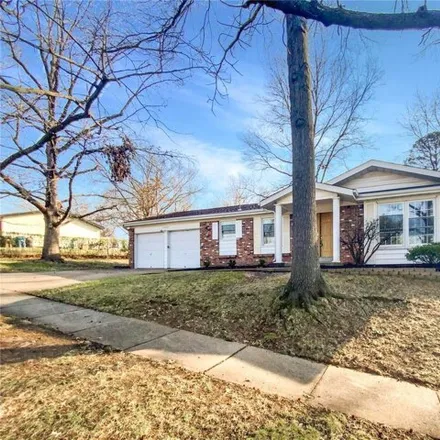
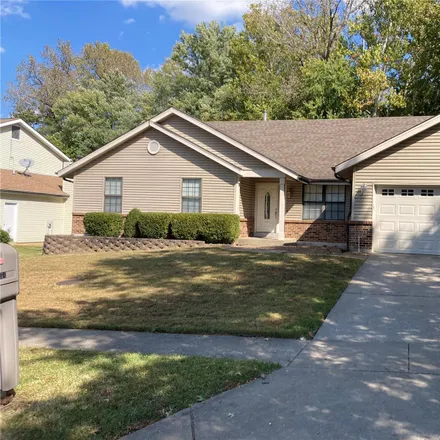
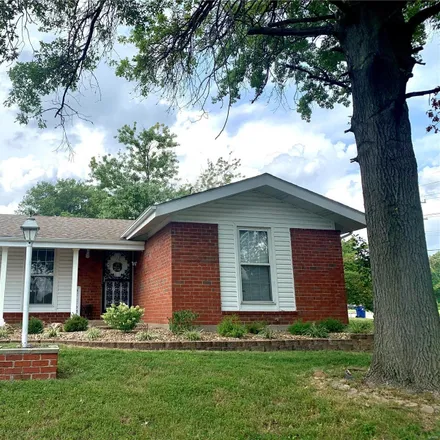
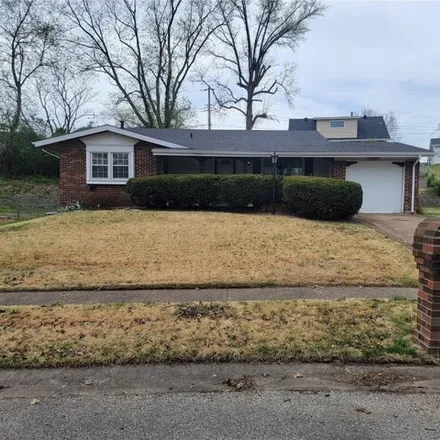
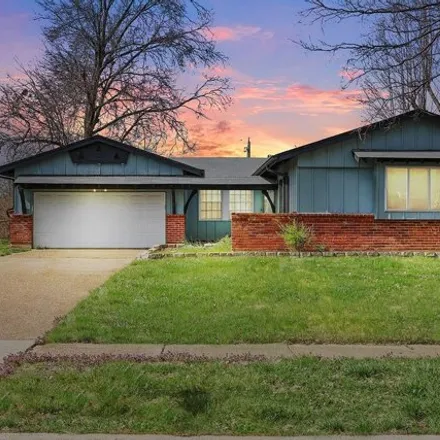
Welcome home to this charming nearly all brick ranch situated perfectly on a quiet cul-de-sac. This 3 bed/2 bath home with 2-car garage boasts a spacious floor plan and newer vinyl plank flooring throughout. Formal dining room and living room greet y...
$119,900
$119,900
Available: Right Now
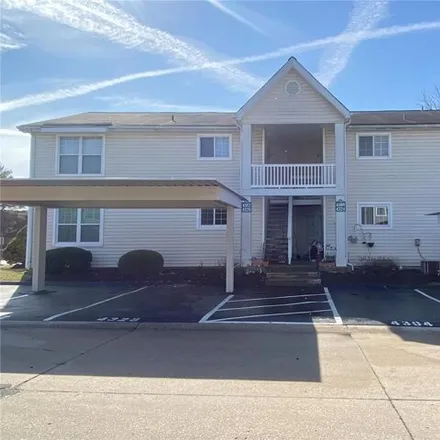
Don't miss out on this adorable condo with amazing space that you really have to see to believe! Open and appetizing kitchen with solid cabinets, matching appliances, eat-in bar area, is modern and functional! Sun-filled living room connected with di...
$129,000
$129,000
Available: Right Now
Agent Owned. Welcome to 4238 Inlet Isle Dr. Main floor 2 bedroom3 FULLbath unit with basement completely finished. Fresh paint thorugh out. New luxury vinyl flooring and carpet in all bedrooms. New windows in bedrooms and kitchen. All new stainless s...
Black Jack
According to statistics, the population in Black Jack, MO amounts to 6,941, which shows decline 0% compared to the previous year. The median age of the city’s residents is 41. The average household income is $50,329, shifting decline -6% from the past year, and the average property value in Black Jack, MO growth 4% to $124,100 throughout the year.
Household Income
The average household income in Black Jack, MO declined from $53,506 to $50,329 in the past year. This data is an estimate based upon 2,609 households in Black Jack, MO . The chart below presents how household income is distributed in Black Jack, MO in comparison to the revenue allocation amid households nationally.
Property Value
According to data from last year, the average property value in Black Jack, MO shifted from $119,700 to $124,100 throughout the year. The subsequent graph indicates the share of properties in the given price range in Black Jack, MO in comparison to the median property value in the same price segment across the country. According to the data, the greatest share of Black Jack, MO properties falls in the '$100,000 to $124,999' range, which is lower than the most significant median property across the country.
Property Taxes
One of the most important aspects for property owners is the amount of property taxes. This graph shows distribution of property taxes in Black Jack, MO compared to median property taxes around the country. The prevalent amount of property taxes in Black Jack, MO equals $2500, which is less than the national average.