Bolivar, TN 38008, USA apartments for sale
$119,000
$119,000
Available: Right Now
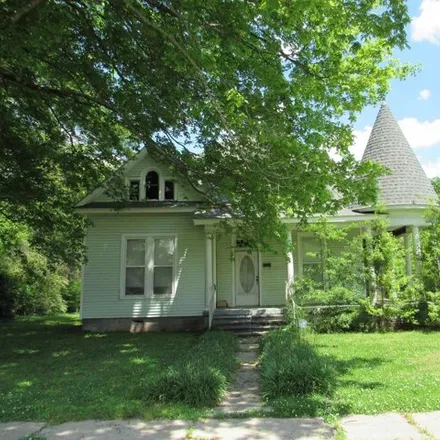
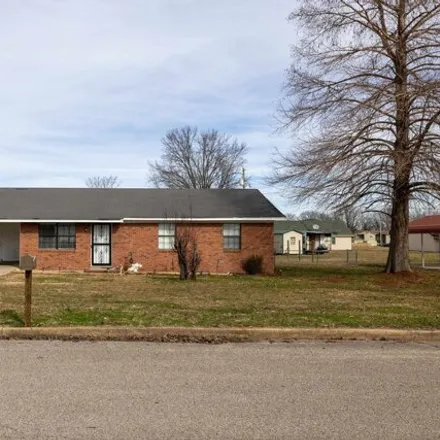
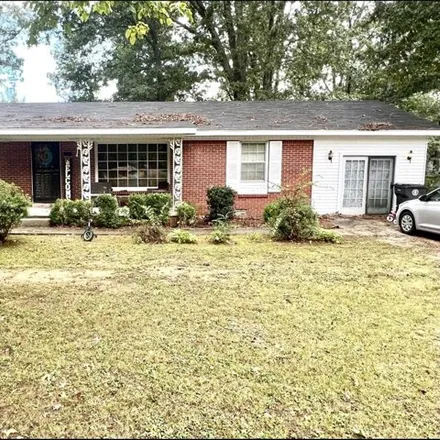
Looking for a large home to make your own or an investment property? This could be the one. 3 bed/2 bath home on a corner lot with central heat/air and roof is only 5 yrs old. Home features tall ceilings, large covered front porch, nice size lot, att...

$139,900
$139,900
Available: Right Now
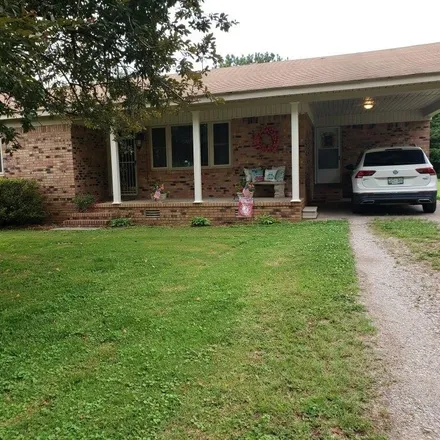
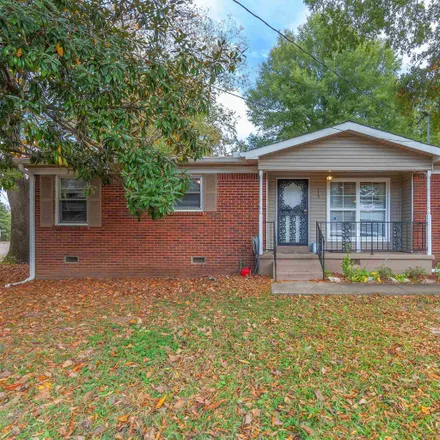
Nestled on a peaceful dead-end street in the heart of Bolivar, Tennessee, this charming small home has been completely remodeled from top to bottom, offering modern comforts with a touch of classic elegance. Perfect for first-time homebuyers or those...
$595,900
$595,900
Available: Right Now
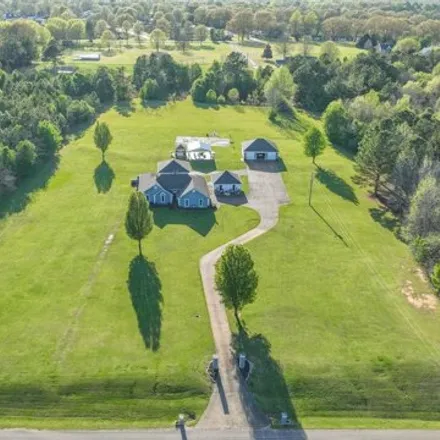
Discover tranquility in this 5bedroom, 4 bathroom, 3, 376sqft home nestled on a 5-acre parcel at the end of a quiet street! Spacious layout and picturesque surroundings, this property offers the perfect blend of privacy and comfort! With its prime lo...
$535,000
$535,000
Available: Right Now
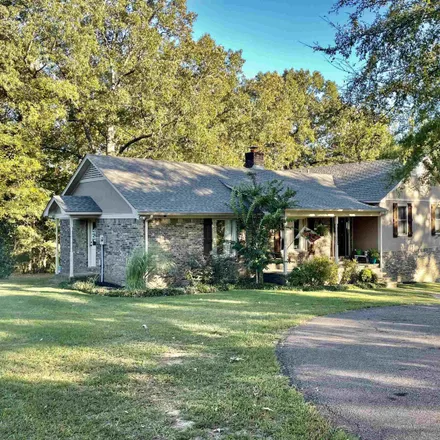
This home with nearly 4 acres at the end of the road is what a residential farm should look like. The former equestrian estate is cross fenced with a 4 stall barn and ready for new hooves. Convenient location just a minute from Market Street in Boliv...

$235,900
$235,900
Available: Right Now
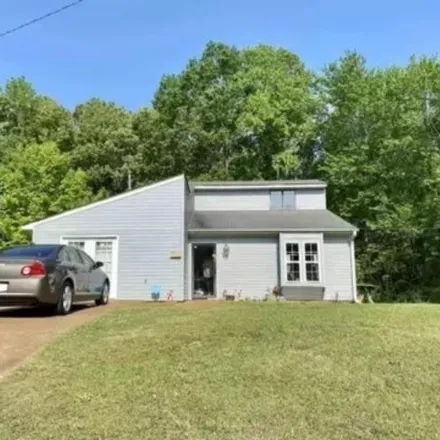
Stunning new Construction home. Step into luxury with this2BR, 2.5-bath gem, with 1197 square feet of elegant living space, this home offers a harmonious blend of comfort and style. Experience seamless living with an open floor plan that maximizes sp...
$449,000
$449,000
Available: Right Now
Stunning, show stopper home with many upgrades to list. Nestled in a picturesque golf community in Bolivar. This gorgeous home has over3, 100square feet, featuring 5 bedrooms and 3.5 bathrooms, including a mastery suite downstairs and one upstairs. A...

$135,000
$135,000
Available: Right Now
1680 Sq Ft Double Wide Home with 3 bedrooms 2 baths only minutes from town....
$100,000
$100,000
Available: Right Now
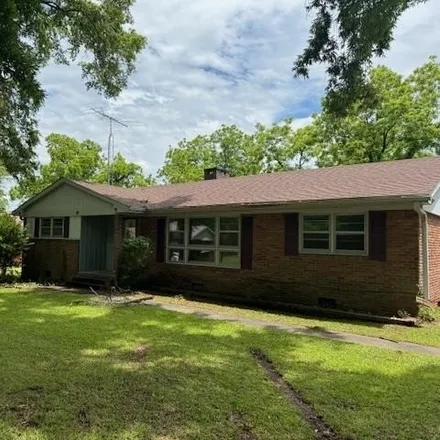
Conveniently located in the city limits of Bolivar close to everything. This 3 bedroom 1 bath brick home with an attached carport is just waiting for its new owners. Hardwood floors throughout the home. Get you appointment scheduled for your showing ...
$199,000
$199,000
Available: Right Now
Take a look at this newly remodeled house! Fresh paint on the walls, new light fixtures, new roof, and flooring throughout. This spacious 5-bedroom, 3-bathroom home also features an office space, totaling 1766 square feet. Conveniently located near s...
$189,000
$189,000
Available: Right Now
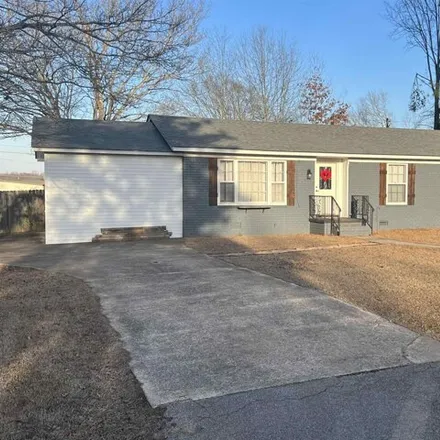
Very nice 3 bedroom, 2 bath brick home with approximately 1540 square feet of living area.! Located in a convenient neighborhood inside the city limits of Bolivar, TN., the home has been recently renovated with modern kitchen, baths, and attractive i...
$349,000
$349,000
Available: Right Now
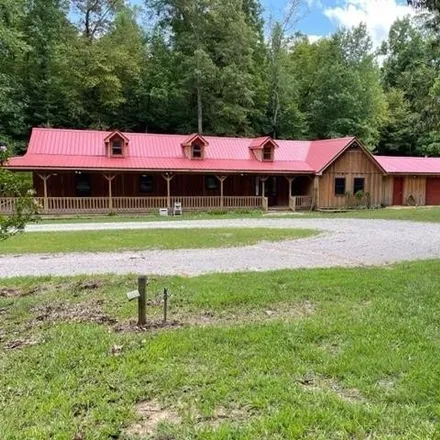
1876 Sq Ft home, 3 bedroom, 2bath, front and back decks, screened in back porch, attached finished garage/shop on 6.5 beautiful acres which also features a storage build with 4 bay closed storage units and one open bay unit....
$155,000
$155,000
Available: Right Now
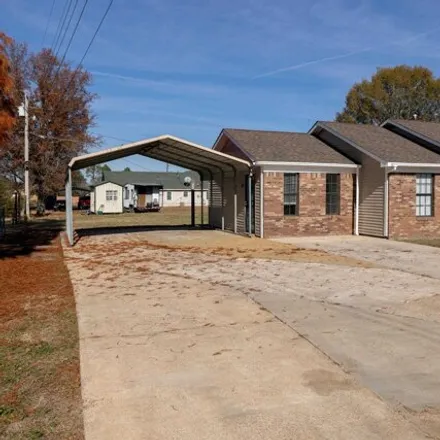
Explore this recently renovated 3-bedroom, 1-bath home in Bolivar. Conveniently located near schools and hospitals, it's just a mile away from Walmart...

$139,900
$139,900
Available: Right Now
Renovated 2 Bedroom, 1 Bath home in downtown Bolivar. New roof, new central heat and air, new flooring, tiled bath and 10 ft. ceilings. Must see!...

$25,000
$25,000
Available: Right Now
Apartment for sale in/on/near 910 Dixon Rd, Bolivar, Tennessee, 38008. The price for this apartment is $25,000. Contact the agent to schedule an open house....

$499,900
$499,900
Available: Right Now
Beautiful 2 story brick home featuring a private setting on 3.7 acres, 5, 290sq ft of living area, formal dinning and living rooms, eat in kitchen, 5 bedrooms, 4.5 baths, Hugh Bonus room, Sun room and large back patio. Too many features to mention...

$545,000
$545,000
Available: Right Now
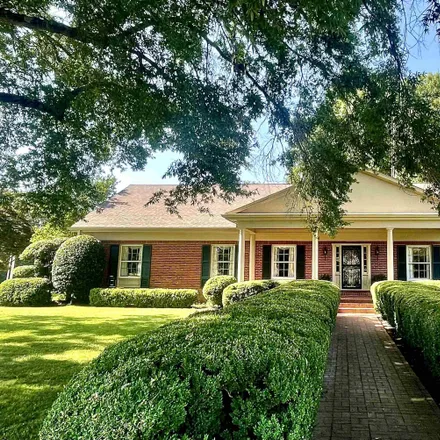
Beautiful 4 Bedroom, 4 Bath home located next to the Hardeman County Golf and Country Club. This is a custom built home on a large fenced lot with over 4000 sq. ft. of living area and a 3 car garage. Many custom features, including a large, spacious ...
$144,500
$144,500
Available: Right Now
House for sale in/on/near Diane Ln, Bolivar, TN, USA.The price for this house is$144,500.This 1146-square-feet 3 bedroom house features 1 bathroom, parking, hardwood floors, dishwasher.Contact the agent to schedule an open house....
$125,000
$125,000
Available: Right Now
This home has plenty to offer with a spacious yard in a quiet neighborhood !!! AS-IS Sale!!!! Seller will not be making any repairs to the home!!!!...
$310,000
$310,000
Available: Right Now
Welcome Home! Beautiful4BR/2BAHome Nestled on 5 Acres in Hardeman County. Escape to the tranquility of Rowland Ln. Large Picture windows & vaulted ceiling in the den bring the outdoors in year round. Rustic wood-burning masonry fireplace keeps the at...
$70,000
$70,000
Available: Right Now
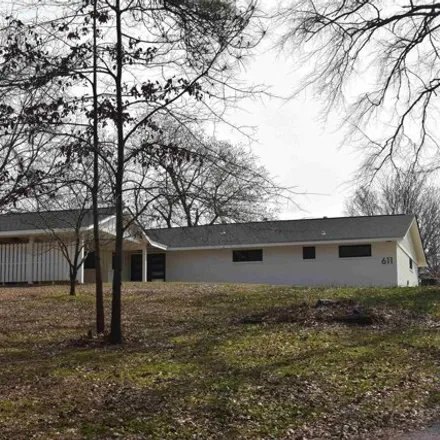
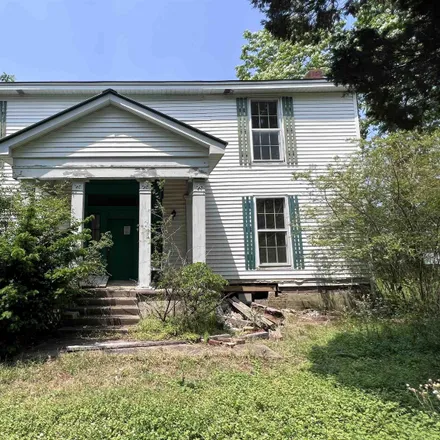
Antebellum-Style Home built 1900, Remodel Began but not finished, Estimated to have Over 3400sf of living space, Being sold in AS-IS condition, Nice Level corner lot, Located in City Limits of Bolivar....
$399,900
$399,900
Available: Right Now
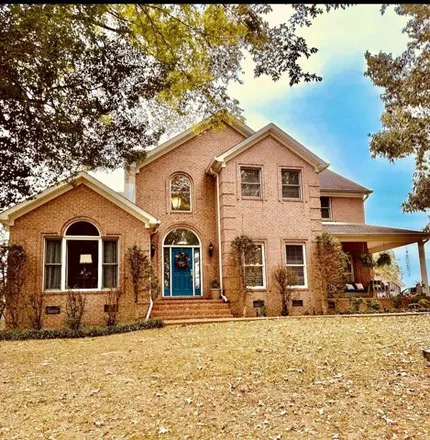
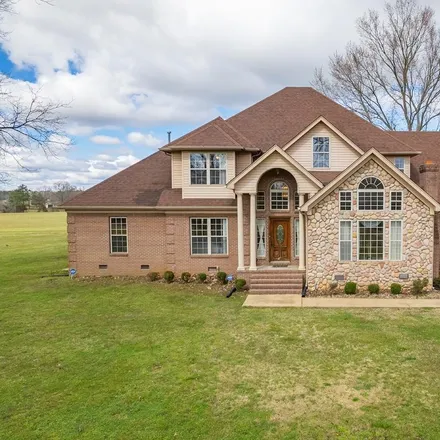
*Stunning 2-Story* home on professionally landscaped corner lot! 5BR/4.5 BAw/almost 4, 000sqft. Smooth 9.5' ceilings/custom molding/hardwood flooring 1st level. Rich woods, built-in walnut bookcase, solid wood paneling & custom fireplace w/marble hea...
$489,000
$489,000
Available: Right Now
House for sale in/on/near 920 Russell Rd, Bolivar, TN, USA.The price for this house is$489,000.This 3573-square-feet 5 bedroom house features 5 bathroom, parking, hardwood floors, fireplace, roof deck, dishwasher.Contact the agent to schedule...
$325,000
$325,000
Available: Right Now
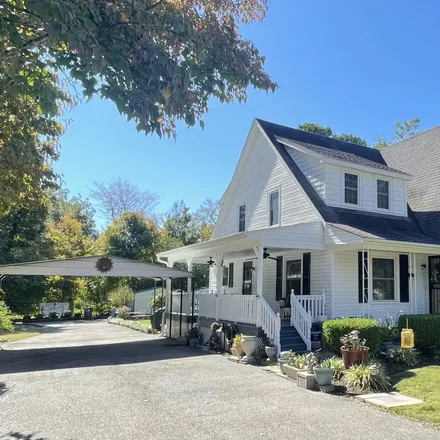
Charm Plus Luxury! *Beautiful4BR/3BAHome built in 1948 & Updated in 2010* New electrical, plumbing, drywall, refinished Hardwood floors! Perfect for Large Families, Entertaining, or an AirBnB. Gorgeous open eat-in kitchen with Corian countertops, ss ...
$145,000
$145,000
Available: Right Now
Take a look at this 3 bedroom, 2 bath brick home with hardwood floors, spacious kitchen and den. Conveniently located at 1389 West Market Street, priced to sell quick!...
$138,900
$138,900
Available: Right Now
This 3 bedroom 2 bath home is Move in Ready, new roof, gutters, waterproof laminate flooring, carpet and all new appliances, a large masterbedroom, large master bath with a jacuzzi tub and shower. This home also features a large deck with a fenced in...
$400,000
$400,000
Available: Right Now
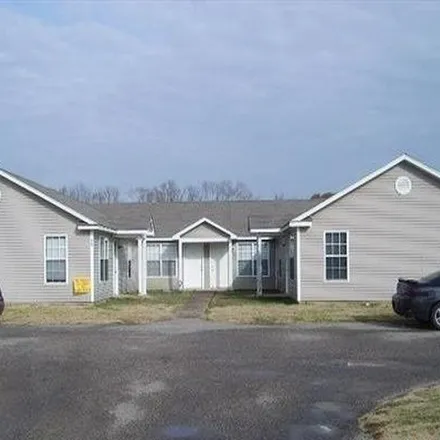
Duplex for sale in/on/near 106 Hines Boulevard, Bolivar, TN 38008, USA.The price for this duplex is$400,000.This 3456-square-feet Studio duplex features 1 bathroom, parking, air conditioning, dishwasher.Contact the agent to schedule an open h...
Bolivar
According to statistics, the population in Bolivar, TN amounts to 5,037, which shows decline -2% compared to the previous year. The median age of the city’s residents is 46. The average household income is $31,899, shifting growth 1% from the past year, and the average property value in Bolivar, TN growth 7% to $97,000 throughout the year.
What is the Average Price of Apartments for Sale in Bolivar, TN, 38008?
| Month | Median Price |
|---|---|
| Jun 2024 |
$237,292
|
| May 2024 |
$225,708
|
| Apr 2024 |
$250,454
|
| Mar 2024 |
$250,454
|
| Feb 2024 |
$250,454
|
| Jan 2024 |
$250,454
|
| Month | Median Price |
|---|---|
| Jun 2024 |
$240,745
|
| May 2024 |
$240,899
|
| Apr 2024 |
$256,973
|
| Mar 2024 |
$256,973
|
| Feb 2024 |
$256,973
|
| Jan 2024 |
$256,973
|
Household Income
The average household income in Bolivar, TN grew from $31,449 to $31,899 in the past year. This data is an estimate based upon 2,010 households in Bolivar, TN . The chart below presents how household income is distributed in Bolivar, TN in comparison to the revenue allocation amid households nationally.
Property Value
According to data from last year, the average property value in Bolivar, TN shifted from $90,800 to $97,000 throughout the year. The subsequent graph indicates the share of properties in the given price range in Bolivar, TN in comparison to the median property value in the same price segment across the country. According to the data, the greatest share of Bolivar, TN properties falls in the '$125,000 to $149,999' range, which is lower than the most significant median property across the country.
Property Taxes
One of the most important aspects for property owners is the amount of property taxes. This graph shows distribution of property taxes in Bolivar, TN compared to median property taxes around the country. The prevalent amount of property taxes in Bolivar, TN equals $1150, which is less than the national average.