Brawley, CA 92227, USA apartments for sale
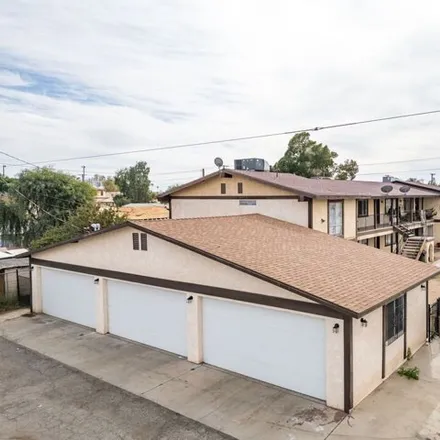
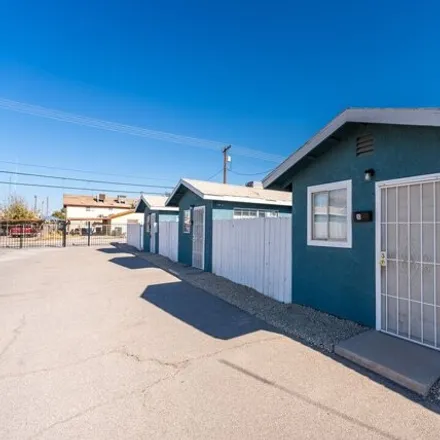
$999,000
$999,000
Available: Right Now
One of the best investments on the earth is Real Estate. Here is a wonderful opportunity to own a 6-plex in a very desired area of the town. Currently, all units are rented. The parking garage is desired by the tenants. The property has 6 6-car garag...
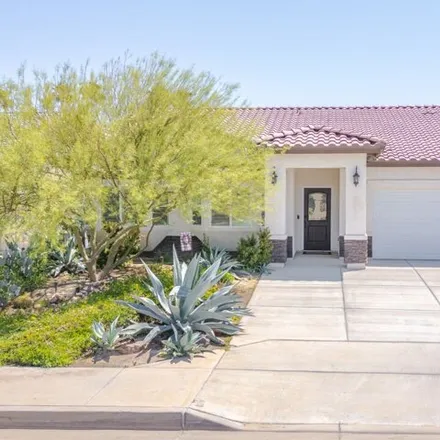
$470,000
$470,000
Available: Right Now
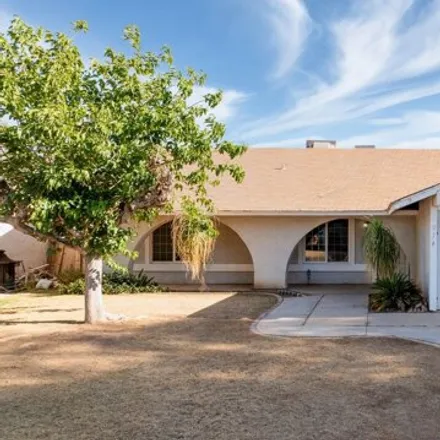
Welcome to luxury living in the highly sought-after Ridge Park community of Brawley! This stunning 4-bedroom, 2-bathroom home offers unparalleled elegance and comfort, all on one expansive level. Step inside to discover a breathtaking interior boasti...
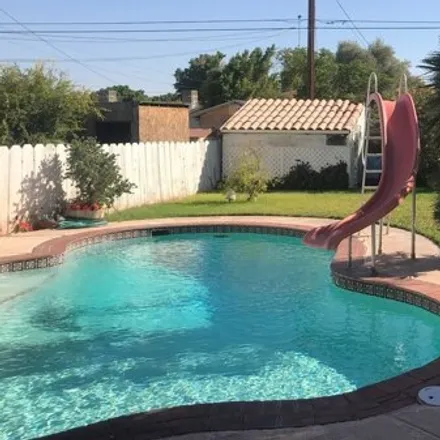
$439,000
$439,000
Available: Right Now
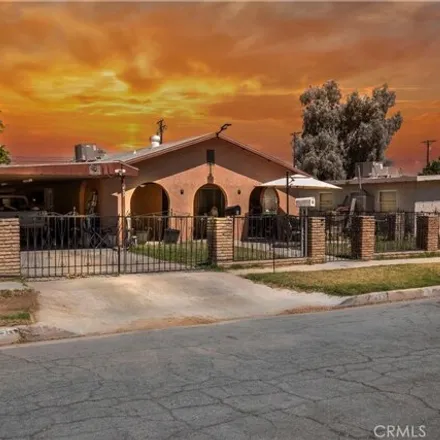
Brawley home with a Pool! Located in Central Brawley. Perfect for hosting gatherings! 2, 281 sq ft! Zoning is R3. (3 homes allowed on this property). Several rooms can be rented out due to their private entrance and private access to its restroom. 5 ...
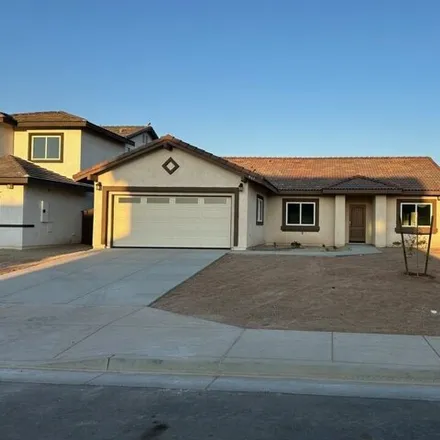
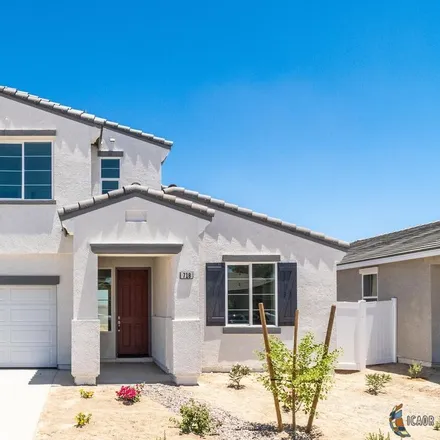
$403,165
$403,165
Available: Right Now
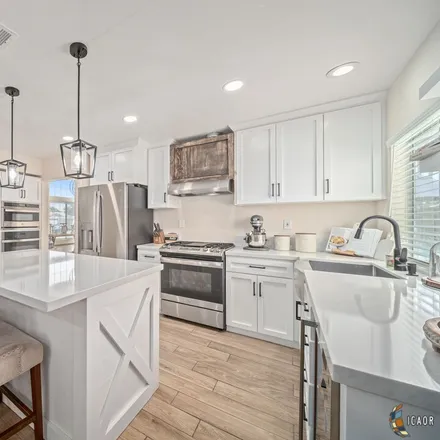
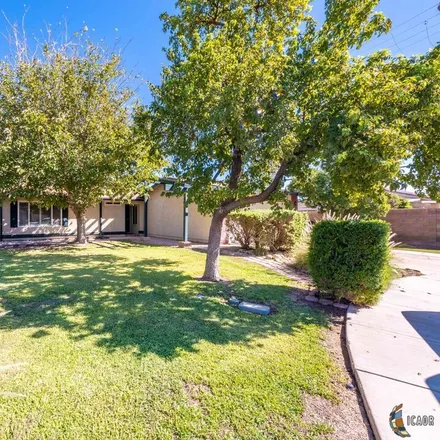
Welcome to this stunning single story home in the heart of it all! Step inside and be greeted by beautiful open floor plan, perfect for entertaining and gathering with friends and family. Enjoy cooking in the spacious kitchen featuring quartz counter...
$399,900
$399,900
Available: Right Now
$441,400
$441,400
Available: Right Now
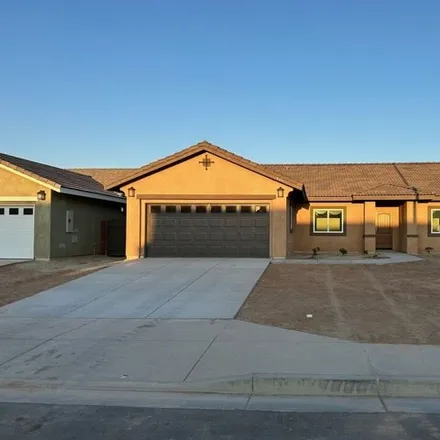
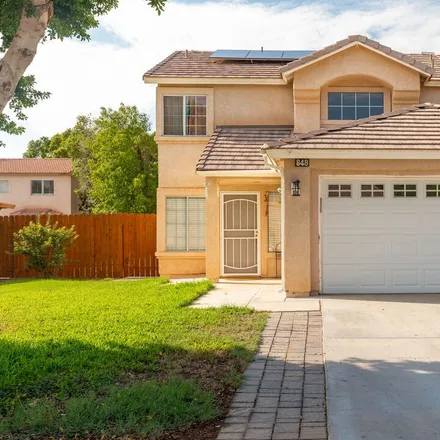
Welcome to New construction in Brawley (SETINA)! This home is a stunning Plan 2100 two-story featuring an open floor plan on a large lot with a convenient Downstairs bedroom and full bathroom. It's packed with charm, from the 4 bedrooms...
$334,000
$334,000
Available: Right Now
$413,165
$413,165
Available: Right Now
Welcome to this stunning single story home in the heart of it all! Step inside and be greeted by beautiful open floor plan, perfect for entertaining and gathering with friends and family. Enjoy cooking in the spacious kitchen featuring quartz counter...
$380,000
$380,000
Available: Right Now
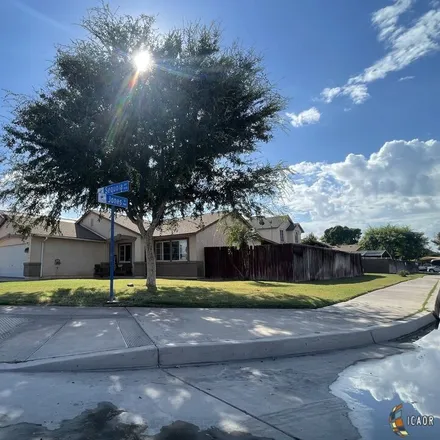
Welcome to274 W.Trail St. in Brawley, CA! This home is in one of Brawley's most desirable neighborhoods! The home consists of 4 bedrooms and 2 bathrooms. Entering the home you are welcomed into the main living room, then the kitchen/dining room and a...
$330,000
$330,000
Available: Right Now
$324,500
$324,500
Available: Right Now
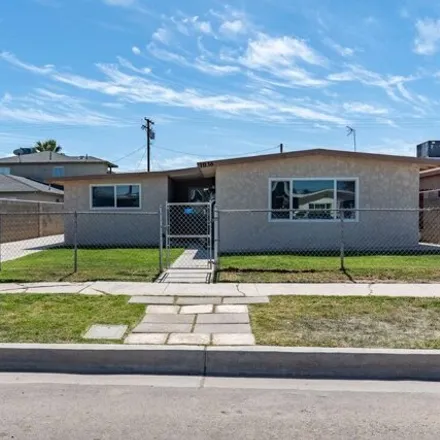
Here's an excellent opportunity for a first time home buyer to purchase this turn-key home. This home features 4 bedrooms, 2 full bathroom, newly installed AC unit 3 years ago, water heater two years old, new electrical panel installed about a year a...
$259,900
$259,900
Available: Right Now
$399,000
$399,000
Available: Right Now
Welcome to 459 J St. in Brawley, California , 2 houses for the price of one ! This inviting home boasts three spacious bedrooms and two bathrooms, providing ample space for comfortable living. Nestled on a serene street, this property features...

$335,000
$335,000
Available: Right Now
Welcome to 993 Flammang Ave at Parkside Estates subdivision! Whether you're a first-time home buyer, or looking to expand your real estate portfolio, this is the perfect home that you have been waiting for. Step inside and feel the inviting and cozy ...
$325,000
$325,000
Available: Right Now
$310,500
$310,500
Available: Right Now
$451,400
$451,400
Available: Right Now
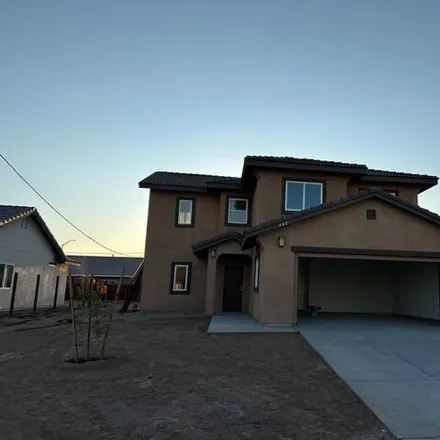
Welcome to New construction in Brawley! This home is a stunning Plan 2100 two-story featuring an open floor plan on a corner lot with a convenient Downstairs bedroom and full bathroom. It's packed with charm, from the 4 bedrooms and 3 f...
$990,000
$990,000
Available: Right Now
This eight-unit apartment building represents a remarkable investment opportunity, located in the heart of Brawley CA. The property boasts stable tenants and a consistent rental history, making it an attractive and secure investment option. Each unit...
$575,000
$575,000
Available: Right Now
Welcome to this great house situated in a corner lot, offers 6-bedroom 3.5-bathroom in the city of Brawley, Ca! Magnificent home with spacious interior square footage at approximately3, 174square feet. As you enter you will have a great-sized living ...
$350,000
$350,000
Available: Right Now
$453,500
$453,500
Available: Right Now
$240,000
$240,000
Available: Right Now
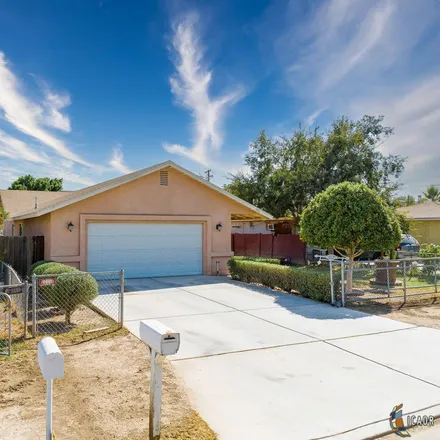
Extra spacious home located in northwest Brawley. It sits on a large lot with 3 bedrooms and 2 bathrooms. This home has a large living room addition, newer windows, wood shutters, and a big backyard. This home is a fixer upper/cosmetic and will give ...
Brawley
According to statistics, the population in Brawley, CA amounts to 25,959, which shows decline 1% compared to the previous year. The median age of the city’s residents is 32. The average household income is $43,469, shifting growth 7% from the past year, and the average property value in Brawley, CA growth 5% to $158,000 throughout the year.
Household Income
The average household income in Brawley, CA grew from $40,745 to $43,469 in the past year. This data is an estimate based upon 7,056 households in Brawley, CA . The chart below presents how household income is distributed in Brawley, CA in comparison to the revenue allocation amid households nationally.
Property Value
According to data from last year, the average property value in Brawley, CA shifted from $150,100 to $158,000 throughout the year. The subsequent graph indicates the share of properties in the given price range in Brawley, CA in comparison to the median property value in the same price segment across the country. According to the data, the greatest share of Brawley, CA properties falls in the '$100,000 to $124,999' range, which is higher than the most significant median property across the country.
Property Taxes
One of the most important aspects for property owners is the amount of property taxes. This graph shows distribution of property taxes in Brawley, CA compared to median property taxes around the country. The prevalent amount of property taxes in Brawley, CA equals $1150, which is less than the national average.