Briarcliff, TX 78669, USA apartments for sale

$539,995
$539,995
Available: Right Now
Nestled within the serene community of Briarcliff in the Texas Hill Country, this delightful family home offers a perfect blend of comfort, convenience, and character. Situated on a prime double lot, 107 Scone Dr offers ample outdoor space for entert...

$639,900
$639,900
Available: Right Now
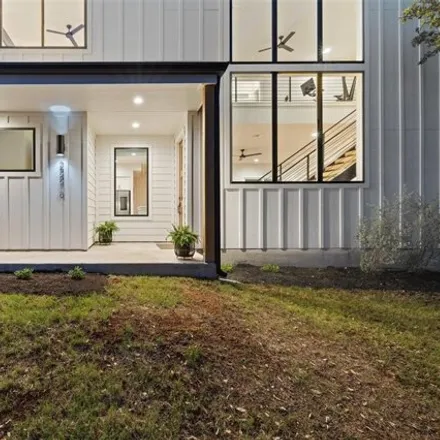
Home is being sold with an extra lot! Experience luxury living with breathtaking hill country views in this exquisite home boasting phenomenal finishes. The spacious interior features vaulted ceilings, granite countertops, and sleek concrete floors, ...

$598,000
$598,000
Available: Right Now
Located in highly sought after Lake Travis ISD this 4-bedroom, 3-bathroom, 2, 325 SFhome is located on a spacious.31 acre lot in Briarcliff with a marina and lake access. Drive your golf cart to Willies Golf Course as well as The Lighthouse Restauran...

$529,900
$529,900
Available: Right Now
Nestled in the esteemed Briarcliff community of Spicewood, this splendid home sits on a generous 1/3 acre lot, radiating charm and elegance. It's thoughtful design features an open floor plan full of natural light and easy flow for entertaining, with...

$2,3M
$2,3M
Available: Right Now
This single-story contemporary gem was completely and masterfully renovated with meticulous details inside and out. High ceilings and abundant windows capture the beauty of this waterfront oasis. Inside is a modern relaxed feel with light and white s...

$530,000
$530,000
Available: Right Now
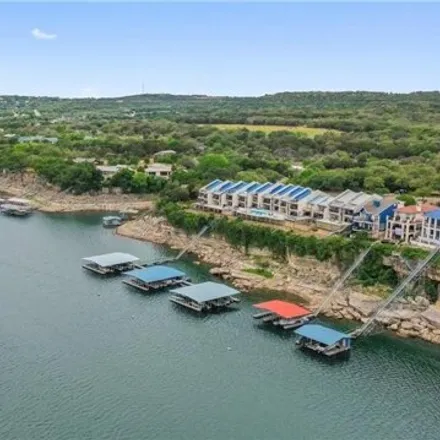
Truly a rare find on the south side of Lake Travis: 3 bedroom, 2 bath, 1279 SF,waterfront condo in Spicewood w/deep water boat slip w/lift, jet ski float, pool, hot tub, awesome views and covered parking. Close to Pace Bend Park with incredible hikin...

$949,000
$949,000
Available: Right Now
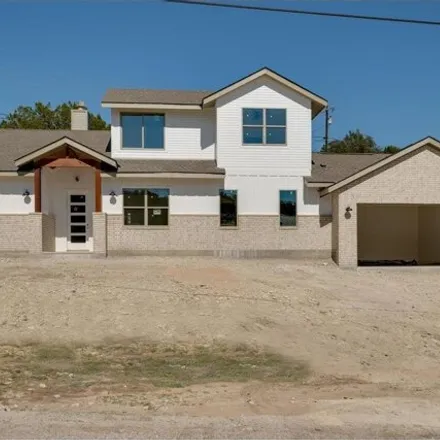
Preferred builder lender incentive to include $5k towards closing costs or rate buy-down. Welcome to your brand new four-bedroom home in the highly sought after community of Briarcliff. With a low tax rate and HOA dues of only $317/year, this is the ...

$365,000
$365,000
Available: Right Now
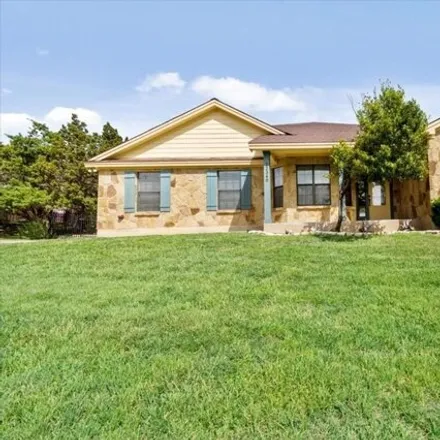
Fabulous 1 story w/ excellent layout and yard in sought-after Lake Travis ISD!! Home has been pre-inspected and is ready to personalize to YOUR taste! (It's also priced below appraised value to leave room for all the upgrades you might want!) Bright ...
$779,000
$779,000
Available: Right Now
Custom built home by Capitex Homes LLC. Estimated completion date March31, 2024.Manuel Ayala is a visionary builder with focus on excellence and quality of workmanship. He has both Graduate Master Builder and Certified Green Professional recognitions...

$3,5M
$3,5M
Available: Right Now
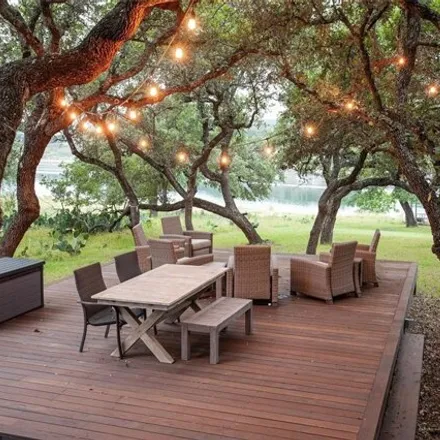
This is such a huge, unique waterfront property with multiple structures, you MUST look at the tour to see it all!! Discover an unparalleled blend of natural beauty and architectural elegance in this sprawling waterfront estate, nestled on 4.9 acres ...
$795,000
$795,000
Available: Right Now
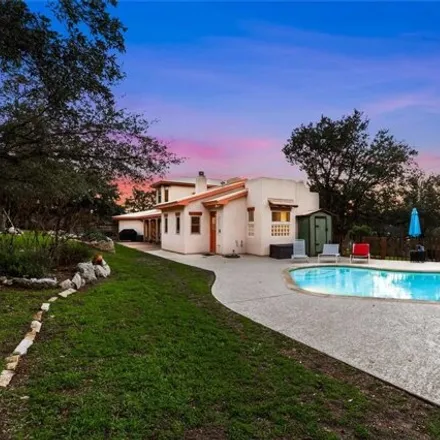
Rare property on 3 lots! Welcome to an unparalleled oasis nestled in the heart of Spicewood. This exquisite 3-bedroom, 3-bathroom residence is a testament to refined living, occupying a sprawling 1.2-acre estate in the coveted Briarcliff community. A...

$599,000
$599,000
Available: Right Now
Welcome to your dream home in the highly desirable Briarcliff neighborhood, just a short walk from the Briarcliff Marina on Lake Travis. This beautifully remodeled home has been extensively updated over the past year, making it truly move-in ready. S...
$1,69M
$1,69M
Available: Right Now
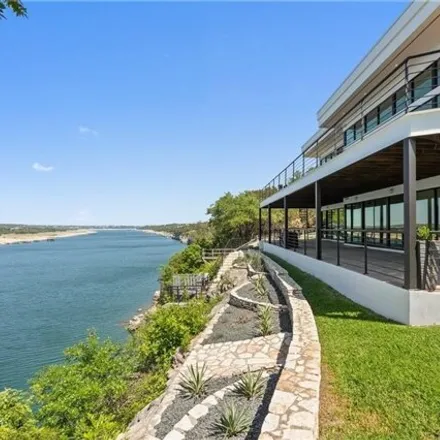
Experience the pinnacle of waterfront living in this stunning4, 201-square-foot home that includes a private boat dock with deep water access. This expansive 4-bedroom, 3-bathroom property is designed for comfort and entertainment, featuring a spacio...

$575,000
$575,000
Available: Right Now
Purchase 631 Galston Dr and 610 Cargill Dr together for a total of.74 acres!! Experience the lifestyle you've been waiting for at this serene Briarcliff home, perfectly situated just minutes from the Pedernales Golf Course, parks, and blocks from the...
$399,000
$399,000
Available: Right Now
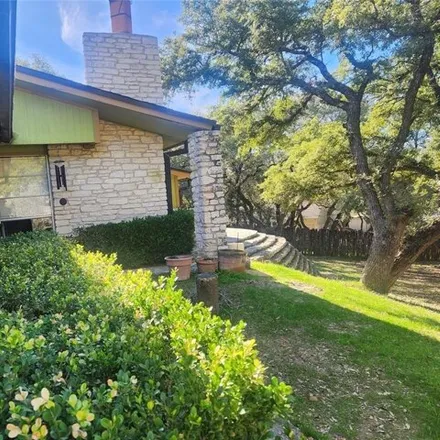
Very charming hillside home in lovely tree shaded oak grove between Willie Nelson's golf course and the Briarcliff boat launch into Lake Travis at the Lighthouse Restaurant. Lots of granite counter top in well laid out spacious kitchen. Roomy master,...

$1,4M
$1,4M
Available: Right Now
Nestled in the Texas Hill Country, this captivating hillside retreat offers a unique blend of rustic charm and modern luxury. Boasting over 3400 square feet, this two-story 3 bedroom 4 bathroom is surrounded by mature oak trees and lush landscaping, ...
$885,000
$885,000
Available: Right Now
Welcome home to Briarcliff on Lake Travis where the breezes are light and the days are relaxed. This modern custom home was built in 2020 by BRB Development, LLC offering exceptional living near the lake. Fantastic open floor plan with tall ceilings ...
$550,000
$550,000
Available: Right Now
Welcome to the lake! BIG Lake Travis and Hill Country Views! Rarely do these waterfront condos come on the market! This completely Renovated one-bedroom, one-bathroom unit is just steps away from the private community pool and Hot Tub. The seller is ...

$489,000
$489,000
Available: Right Now
This beautiful home is located in the Village of Briarcliff. Homeowners have access to Lake Travis, the BBQ pit/grill, common grounds, the park, playground, restaurant, tennis court(s), walking/biking/hiking and jogging trails. This subdivision is of...
$489,000
$489,000
Available: Right Now
Short Sale! Welcome to your home in the beautiful Village of Briarcliff! This well maintained, light and bright 3 bedroom 2 bathroom is nestled in the heart of the community. The home boasts an open floor plan, large primary bedroom looking out on th...
$3,25M
$3,25M
Available: Right Now
This iconic Lake Travis contemporary waterfront home is one of a kind! Boasting 135 feet of waterfront on deep water with Breathtaking 180 Degree views from every room in the house. Recent Appraisal@$4, 500, 000.Dramatic modern architecture with expa...
$1,15M
$1,15M
Available: Right Now
Welcome to the lake! Current owner uses as a lake house retreat but the water is low. Spacious 4 bedroom 2 1/2 bath with downstairs game room. 2 Decks upper and lower. New HVAC and New12, 000 BTU PTACin sun room. New19 SEERvariable speed heat pump up...
Briarcliff
According to statistics, the population in Briarcliff, TX amounts to 1,657, which shows growth 6% compared to the previous year. The median age of the city’s residents is 47. The average household income is $105,647, shifting growth 16% from the past year, and the average property value in Briarcliff, TX growth 8% to $288,700 throughout the year.
Household Income
The average household income in Briarcliff, TX grew from $91,417 to $105,647 in the past year. This data is an estimate based upon 645 households in Briarcliff, TX . The chart below presents how household income is distributed in Briarcliff, TX in comparison to the revenue allocation amid households nationally.
Property Value
According to data from last year, the average property value in Briarcliff, TX shifted from $267,500 to $288,700 throughout the year. The subsequent graph indicates the share of properties in the given price range in Briarcliff, TX in comparison to the median property value in the same price segment across the country. According to the data, the greatest share of Briarcliff, TX properties falls in the '$300,000 to $399,999' range, which is higher than the most significant median property across the country.
Property Taxes
One of the most important aspects for property owners is the amount of property taxes. This graph shows distribution of property taxes in Briarcliff, TX compared to median property taxes around the country. The prevalent amount of property taxes in Briarcliff, TX equals $3000, which is less than the national average.