Bridgeport, AL 35740, USA apartments for sale

$119,000
$119,000
Available: Right Now
Great 2 bedroom, 1 bath starter home for those looking to downsize, investment property or rental on large lot. (Lots 23-30) This home is located only minutes from downtown Bridgeport and Tennessee River boat launch. If you love to garden this has th...
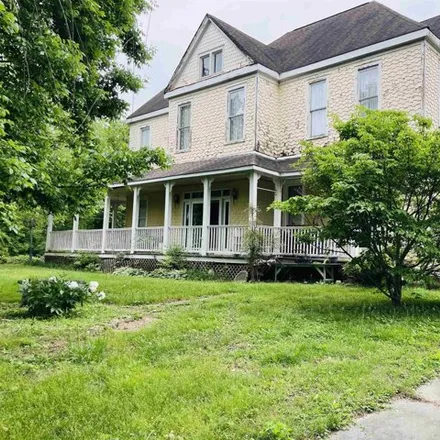
$250,000
$250,000
Available: Right Now
Walking beyond the wrap around porch into this home on Battery Hill will take you back in time as the 11' ceilings, multiple fire places, and beautifully crafted wood work will capture your heart and imagination. Built in the 1890's, this gorgeous vi...
$199,900
$199,900
Available: Right Now
Nestled in the heart of Bridgeport, Alabama, this charming all-brick home boasts 2 bedrooms and 1.5 baths, offering a blend of classic elegance and modern updates. The interior features stunning hardwood floors and a kitchen adorned with custom cabin...
$389,000
$389,000
Available: Right Now
Welcome to Sweet home Alabama! This Mini farm sits on 4.70 acres with beautiful Mountain views. Amish built barn has six stalls, hayloft, and fenced in area for all your farm animals. Renovated Ranch style home with fresh paint features 2 bedrooms, 3...

$425,000
$425,000
Available: Right Now
Welcome to 203 Stella Dr, this charming country colonial has 3 bedrooms, 3 full bathrooms, office, large bonus room and full basement. This home sits on just under 1 acre with amazing mountain views and pond views! The home features a beautiful 2 sto...

$164,995
$164,995
Available: Right Now
Beautiful Victorian Home with unlimited potential!! This property is a 4 bedroom 2 bathroom 2400 square foot home in need of cosmetic updates and landscaping to bring it up to modern standard and offers an incredible for anyone looking to put in some...
$149,900
$149,900
Available: Right Now
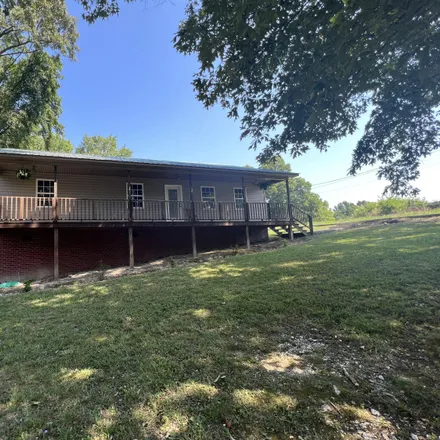
Attention all investors. !!Come check out this 3 bedroom / 1 bathroom fixer-upper . The house is sitting on over 6.56 Acres in Bridgeport. Home is being sold as is. House was recently used as a rental. Acreage is Beautiful and would make a great subd...
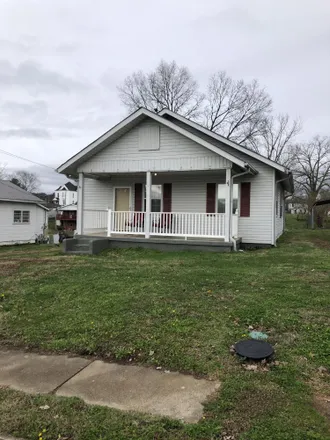
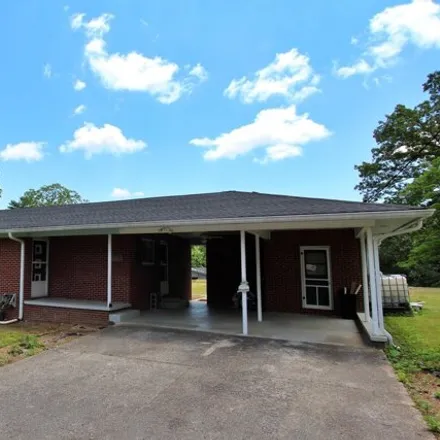
$89,900
$89,900
Available: Right Now
Well maintained older home close to downtown. This2BR/1BAhome has been completely remodeled. Home has a new HVAC....
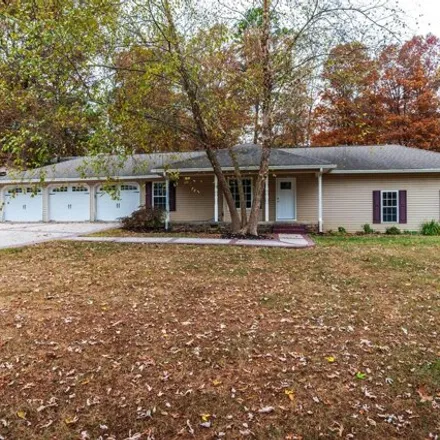
$374,900
$374,900
Available: Right Now
You don't want to miss this great 4 bedroom, 2.5 bath home, on 4 lots/1 acre. Enjoy the relaxing back yard with a water feature, Gunite pool with an automatic cover, outdoor kitchen and storm shelter. All pool equipment and whole house Generac genera...
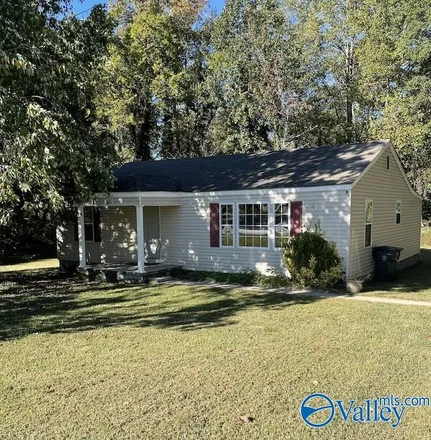
$150,000
$150,000
Available: Right Now
3 bedroom home in Hazel Green school district! Spacious living room has wood floors and ceiling fan. Tile in kitchen and laundry room. Formal living room with wood floors. 3 bedrooms all with carpet. Great starter home!...
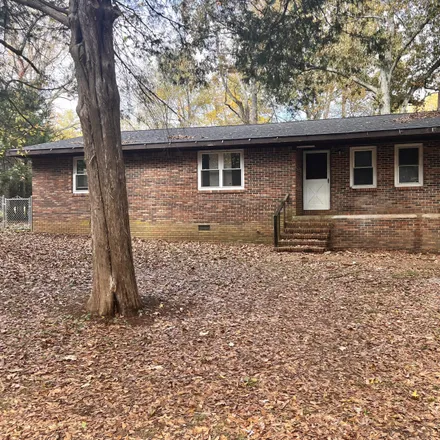
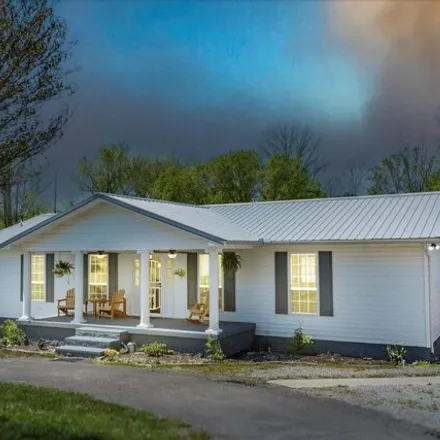
$189,000
$189,000
Available: Right Now
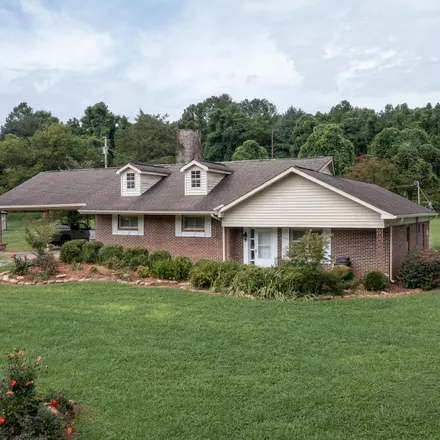
Enjoy country living just outside the Bridgeport city limits in this totally updated3 BR 1.5 BAall brick ranch style home on one acre. Open stacked stone fireplace kitchen with stainless steel stove & dishwasher. Metal detached building.All bedrooms ...
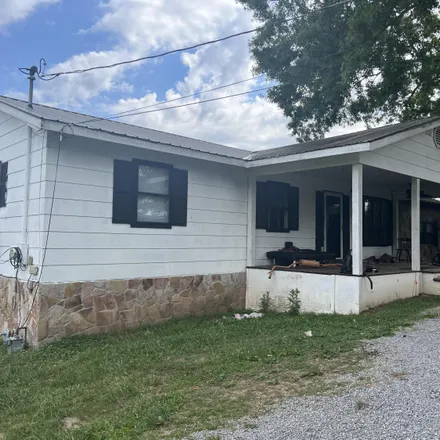
$179,900
$179,900
Available: Right Now
You'll want to see this Newly updated home in Bridgeport! This ranch home has it all Inside you will find an OPEN living area with built-is, hardwood floors, a Bar/island work center, stainless steel appliances, and spacious bedrooms owner's s...
$399,900
$399,900
Available: Right Now
Gorgeous acreage w/ 2000 sq ft brick home. Live in the home and rent out the 4 units (2 duplexes) to make your payments. Home features include: 3 bdr/2 ba, appliances, large walk in closet, and master bath, built in shelving, double carport, and an e...
Bridgeport
According to statistics, the population in Bridgeport, AL amounts to 2,330, which shows decline -8% compared to the previous year. The median age of the city’s residents is 39. The average household income is $30,852, shifting growth 6% from the past year, and the average property value in Bridgeport, AL growth 3% to $68,000 throughout the year.
What is the Average Price of Apartments for Sale in Bridgeport, AL, 35740?
| Month | Median Price |
|---|---|
| Jun 2024 |
$264,895
|
| May 2024 |
$278,369
|
| Apr 2024 |
$222,588
|
| Mar 2024 |
$222,588
|
| Feb 2024 |
$222,588
|
| Jan 2024 |
$222,588
|
| Month | Median Price |
|---|---|
| Jun 2024 |
$348,441
|
| May 2024 |
$369,623
|
| Apr 2024 |
$344,497
|
| Mar 2024 |
$344,497
|
| Feb 2024 |
$344,497
|
| Jan 2024 |
$344,497
|
Household Income
The average household income in Bridgeport, AL grew from $29,122 to $30,852 in the past year. This data is an estimate based upon 1,032 households in Bridgeport, AL . The chart below presents how household income is distributed in Bridgeport, AL in comparison to the revenue allocation amid households nationally.
Property Value
According to data from last year, the average property value in Bridgeport, AL shifted from $66,200 to $68,000 throughout the year. The subsequent graph indicates the share of properties in the given price range in Bridgeport, AL in comparison to the median property value in the same price segment across the country. According to the data, the greatest share of Bridgeport, AL properties falls in the '$60,000 to $69,999' range, which is higher than the most significant median property across the country.
Property Taxes
One of the most important aspects for property owners is the amount of property taxes. This graph shows distribution of property taxes in Bridgeport, AL compared to median property taxes around the country. The prevalent amount of property taxes in Bridgeport, AL equals $800, which is less than the national average.