Bridgeport, CA 93517, USA apartments for sale
$325,000
$325,000
Available: Right Now
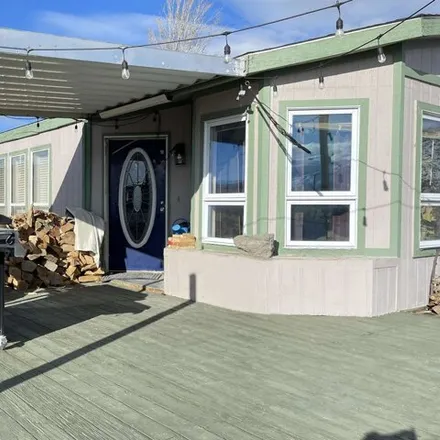
Ranch Style 2-Bedroom/2-Bath/Den home with open floor plan and large breezeway providing tons of extra storage plus 3-Car Garage on separate meter. The main entry leads to a spacious living and dining area with wood burning fireplace. The kitchen pro...
$699,900
$699,900
Available: Right Now
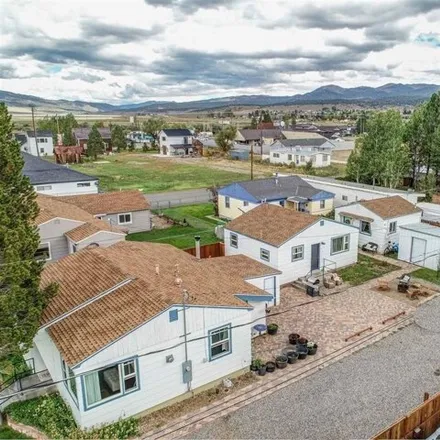
Current Cap of 6.07% with potential to grow. Low vacancy rate and a history of long term tenants. This is an ideal opportunity for someone looking to invest in a multi family property located in an area which has demonstrated a need for housing. Ther...

$1,15M
$1,15M
Available: Right Now
Located on top of a scenic Bluff with Amazing Panoramic Views. Perfectly placed on 4.2 acres, with floor to ceiling windows offering stunning panoramic views of the Eastern Sierras. This home builder was meticulous with planning and built this one of...
Bridgeport
According to statistics, the population in Bridgeport, CA amounts to 629, which shows decline -29% compared to the previous year. The median age of the city’s residents is 55. The average household income is $48,267, shifting decline -3% from the past year, and the average property value in Bridgeport, CA decline 0% to $212,200 throughout the year.
What is the Average Price of Apartments for Sale in Bridgeport, CA, 93517?
| Month | Median Price |
|---|---|
| Jun 2024 |
$264,895
|
| May 2024 |
$278,369
|
| Apr 2024 |
$222,588
|
| Mar 2024 |
$222,588
|
| Feb 2024 |
$222,588
|
| Jan 2024 |
$222,588
|
| Month | Median Price |
|---|---|
| Jun 2024 |
$348,441
|
| May 2024 |
$369,623
|
| Apr 2024 |
$344,497
|
| Mar 2024 |
$344,497
|
| Feb 2024 |
$344,497
|
| Jan 2024 |
$344,497
|
Household Income
The average household income in Bridgeport, CA declined from $49,776 to $48,267 in the past year. This data is an estimate based upon 219 households in Bridgeport, CA . The chart below presents how household income is distributed in Bridgeport, CA in comparison to the revenue allocation amid households nationally.
Property Value
According to data from last year, the average property value in Bridgeport, CA shifted from $212,500 to $212,200 throughout the year. The subsequent graph indicates the share of properties in the given price range in Bridgeport, CA in comparison to the median property value in the same price segment across the country. According to the data, the greatest share of Bridgeport, CA properties falls in the '$200,000 to $249,999' range, which is higher than the most significant median property across the country.
Property Taxes
One of the most important aspects for property owners is the amount of property taxes. This graph shows distribution of property taxes in Bridgeport, CA compared to median property taxes around the country. The prevalent amount of property taxes in Bridgeport, CA equals $1150, which is less than the national average.