Bunker Hill, IL 62014, USA apartments for sale
$139,900
$139,900
Available: Right Now
Welcome home! Discover the perfect blend of convenience and comfort in this good sized 3 bed 2 bath home! Starting outside, this home was made for the country lifestyle! The front porch has space for entertaining while the fenced in area in the back ...
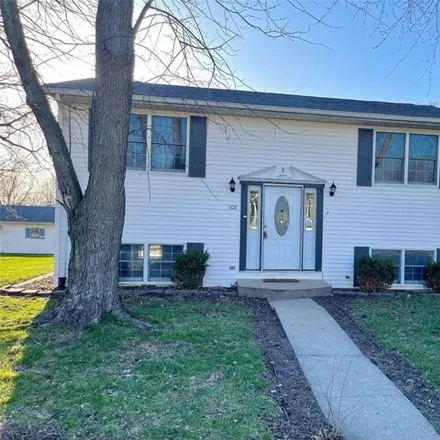
$335,000
$335,000
Available: Right Now
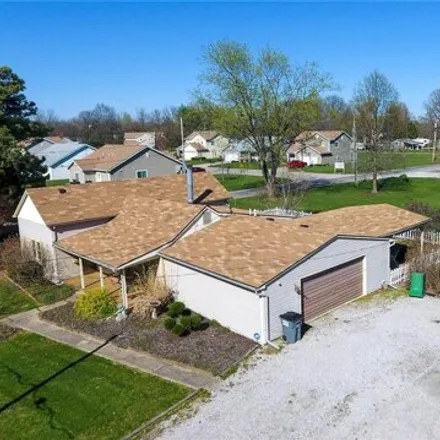
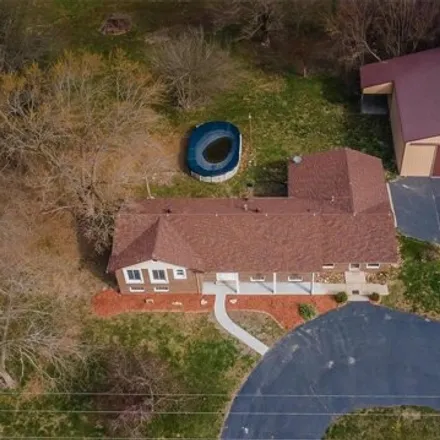
Dont miss this three bedroom, three bath home in Bunker Hill situated on about 1.5 acres. With about2, 700square feet of nicely remodeled finished space you will find plenty of living space and storage area as well as a pole building with electrical....
$160,000
$160,000
Available: Right Now
$139,900
$139,900
Available: Right Now
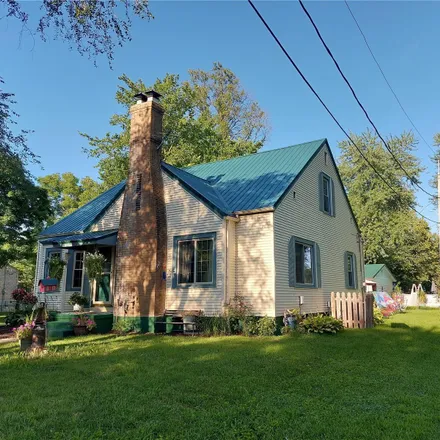
Welcome to your dream home in the tranquil Bunker Hill neighborhood! This charming one-story residence boasts three spacious bedrooms, one and a half bathrooms, and a host of desirable features. The heart of the home is a generously sized living room...
$147,900
$147,900
Available: Right Now
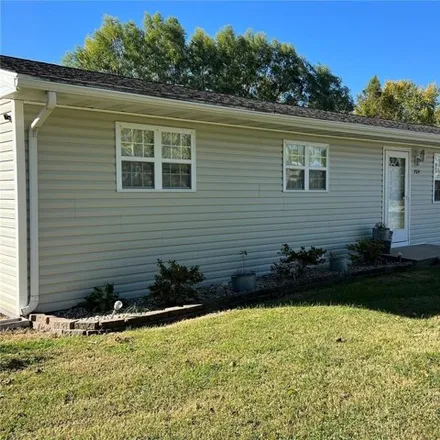
Lots of living space in this 3 bed/2 bath home on a quiet street plus a 28 x 32 shed w/electric in the large backyard. Perfect for any hobbyist! home has new deck and flooring. Roof is 5 years old, heat pump 2014 and water heater 2017. Come check thi...
Bunker Hill
According to statistics, the population in Bunker Hill, IL amounts to 1,816, which shows growth 5% compared to the previous year. The median age of the city’s residents is 43. The average household income is $45,536, shifting decline 0% from the past year, and the average property value in Bunker Hill, IL growth 1% to $92,300 throughout the year.
Household Income
The average household income in Bunker Hill, IL grew from $45,522 to $45,536 in the past year. This data is an estimate based upon 767 households in Bunker Hill, IL . The chart below presents how household income is distributed in Bunker Hill, IL in comparison to the revenue allocation amid households nationally.
Property Value
According to data from last year, the average property value in Bunker Hill, IL shifted from $91,100 to $92,300 throughout the year. The subsequent graph indicates the share of properties in the given price range in Bunker Hill, IL in comparison to the median property value in the same price segment across the country. According to the data, the greatest share of Bunker Hill, IL properties falls in the '$90,000 to $99,999' range, which is lower than the most significant median property across the country.
Property Taxes
One of the most important aspects for property owners is the amount of property taxes. This graph shows distribution of property taxes in Bunker Hill, IL compared to median property taxes around the country. The prevalent amount of property taxes in Bunker Hill, IL equals $1150, which is less than the national average.