Burbank, WA 99323, USA apartments for sale
$1,85M
$1,85M
Available: Right Now
Breathtaking Views from this gorgeous custom built home on the Columbia River with a dock! A little slice of paradise to enjoy the sunrise and sunset. 2004 built 1 1/2 story w/4173 sq ft. private setting on a quiet dead-end street. This home was buil...

$248,900
$248,900
Available: Right Now
MLS# 277091 Welcome Home! This charming property features 2 bedrooms, 1 bathroom, and 804 square feet of living space. As you walk in the front door, the first thing you notice is the upgraded flooring that leads you through the living area to the ki...

$388,000
$388,000
Available: Right Now
This spacious, beautifully cared for 2002 manufactured home is 1809 square feet featuring 3 beds and 2 baths on a comfortable 0.39 acres of land. The kitchen offers convenience and functionality. Never been used wood fireplace, freshly cleaned carpet...

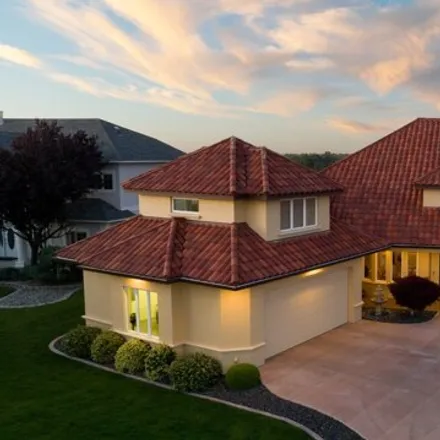
$695,000
$695,000
Available: Right Now
Welcome to serenity at 15 Jackie Ct. This beautiful 3 Bedroom, 2 bath home, plus a den sits on 1 acre, with an unobstructed view of the Mighty Columbia river. This entertainers dream has soaring ceilings, large picture windows and a spacious family r...
$1,5M
$1,5M
Available: Right Now
MLS# 273533 MLS# 269445 Gorgeous Riverfront 1 story Custom Built Stucco Luxury home with over 3100 square feet. This home includes a private boat owners association dock and is located on the majestic Snake River in Burbank, Washington. Spectacular V...
$725,000
$725,000
Available: Right Now
MLS# 272851 Picture this: a slice of paradise in Burbank where the sun dances on 1.50 acres of peaceful countryside! This isn't just a property; it's a canvas for your dreams with opportunity for multi-generational living or rental income in the 70x3...

$410,000
$410,000
Available: Right Now
MLS# 276445 If you are looking for a place to live that is on the Snake River, This may be for you. This property has a large lot,.59 of an acre. It has an unbeatable view of the river. It is also easy to get to, fairly close to all the Tri Cities an...

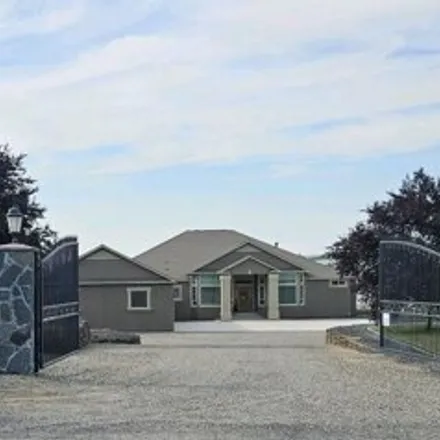
$749,900
$749,900
Available: Right Now
MLS# 276804 Welcome to country living at its absolute finest. This charming, newly built modern farmhouse offers 2 acres with over$250, 000in outdoor and landscaping upgrades. All the hard work has been done! This backyard boasts a luxurious outdoor ...

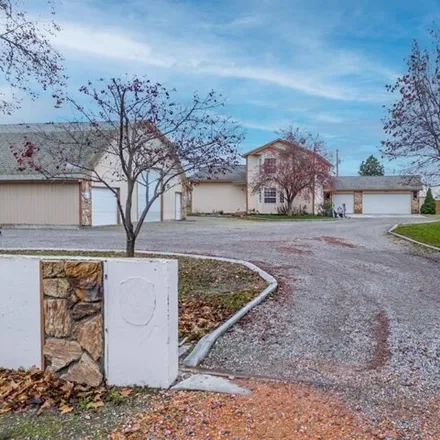
$420,000
$420,000
Available: Right Now
Don't miss the opportunity to call this slice of country-living heaven, your new home. Sitting on a peaceful 1 acre parcel this home faces west allowing you to soak up the morning sun with a cup of coffee as well as enjoy evening shade from the back ...
Burbank
According to statistics, the population in Burbank, WA amounts to 3,398, which shows growth 8% compared to the previous year. The median age of the city’s residents is 42. The average household income is $70,319, shifting growth 1% from the past year, and the average property value in Burbank, WA decline 0% to $171,900 throughout the year.
What is the Average Price of Apartments for Sale in Burbank, WA, 99323?
| Month | Median Price |
|---|---|
| Jun 2024 |
$694,093
|
| May 2024 |
$909,561
|
| Apr 2024 |
$889,624
|
| Mar 2024 |
$889,624
|
| Feb 2024 |
$889,624
|
| Jan 2024 |
$889,624
|
| Month | Median Price |
|---|---|
| Jun 2024 |
$935,306
|
| May 2024 |
$903,437
|
| Apr 2024 |
$912,163
|
| Mar 2024 |
$912,163
|
| Feb 2024 |
$912,163
|
| Jan 2024 |
$912,163
|
Household Income
The average household income in Burbank, WA grew from $69,432 to $70,319 in the past year. This data is an estimate based upon 1,210 households in Burbank, WA . The chart below presents how household income is distributed in Burbank, WA in comparison to the revenue allocation amid households nationally.
Property Value
According to data from last year, the average property value in Burbank, WA shifted from $172,400 to $171,900 throughout the year. The subsequent graph indicates the share of properties in the given price range in Burbank, WA in comparison to the median property value in the same price segment across the country. According to the data, the greatest share of Burbank, WA properties falls in the '$150,000 to $174,999' range, which is lower than the most significant median property across the country.
Property Taxes
One of the most important aspects for property owners is the amount of property taxes. This graph shows distribution of property taxes in Burbank, WA compared to median property taxes around the country. The prevalent amount of property taxes in Burbank, WA equals $3000, which is less than the national average.