Calhoun, MO 65323, USA apartments for sale
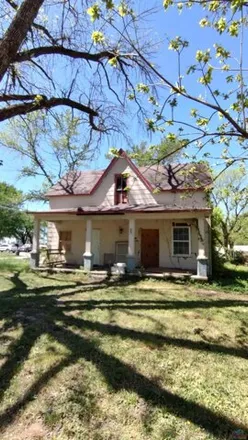
$29,500
$29,500
Available: Right Now
Nice Remodel Project! Most of the demo has been done and has some of the materials to put this home back together already onsite!...
Calhoun
According to statistics, the population in Calhoun, MO amounts to 372, which shows decline -3% compared to the previous year. The median age of the city’s residents is 35. The average household income is $30,278, shifting growth 7% from the past year, and the average property value in Calhoun, MO decline -2% to $48,900 throughout the year.
What is the Average Price of Apartments for Sale in Calhoun, MO, 65323?
| Month | Median Price |
|---|---|
| Jun 2024 |
$357,037
|
| May 2024 |
$299,874
|
| Apr 2024 |
$290,635
|
| Mar 2024 |
$290,635
|
| Feb 2024 |
$290,635
|
| Jan 2024 |
$290,635
|
| Month | Median Price |
|---|---|
| Jun 2024 |
$359,119
|
| May 2024 |
$308,357
|
| Apr 2024 |
$351,529
|
| Mar 2024 |
$351,529
|
| Feb 2024 |
$351,529
|
| Jan 2024 |
$351,529
|
Household Income
The average household income in Calhoun, MO grew from $28,365 to $30,278 in the past year. This data is an estimate based upon 148 households in Calhoun, MO . The chart below presents how household income is distributed in Calhoun, MO in comparison to the revenue allocation amid households nationally.
Property Value
According to data from last year, the average property value in Calhoun, MO shifted from $50,000 to $48,900 throughout the year. The subsequent graph indicates the share of properties in the given price range in Calhoun, MO in comparison to the median property value in the same price segment across the country. According to the data, the greatest share of Calhoun, MO properties falls in the '$40,000 to $49,999' range, which is lower than the most significant median property across the country.
Property Taxes
One of the most important aspects for property owners is the amount of property taxes. This graph shows distribution of property taxes in Calhoun, MO compared to median property taxes around the country. The prevalent amount of property taxes in Calhoun, MO equals $800, which is less than the national average.