Callaway, NE 68825, USA apartments for sale
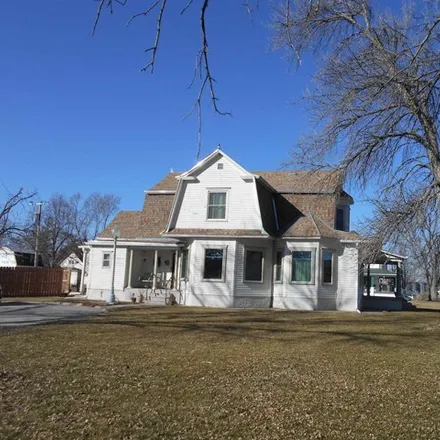
$295,000
$295,000
Available: Right Now
Don't miss your opportunity to view this historic hom in Callaway, Nebraska. Includes all appliances. Beautiful woodwork, main floor bedroomstudy. Located on large corner lot....

$153,000
$153,000
Available: Right Now
4 bedrooms, 2 baths, situated on large corner lot on edge of town. Additional kitchen , bathroom and bedroom in basement....
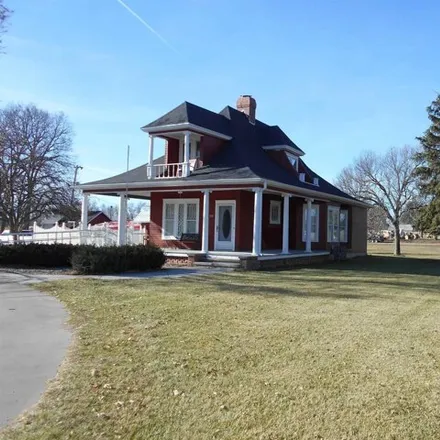
$305,000
$305,000
Available: Right Now
Great home with 3 bedrooms, 2 baths, Large well kept lawn. Spacious lawn with great curb appeal. French doors, garden area, wood floors, open staircase . open house december 6 - 3:00 p.m. to6:00 P.M....
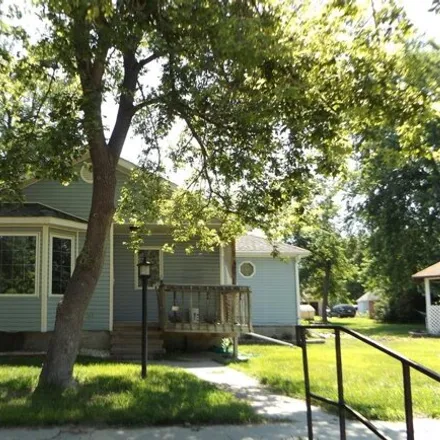
$150,500
$150,500
Available: Right Now
This home sits on a large lot right on main street Callaway! 2 bedrooms on the main, with a 3rd non conforming bedroom in the basement. A large bathroom with a jetted tub and stand alone shower on the main has tons of storage and there is a half bath...
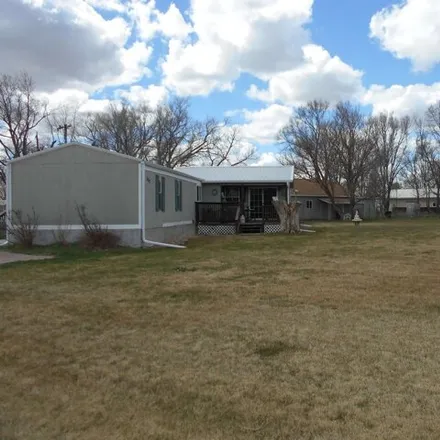
$140,000
$140,000
Available: Right Now
3 bedoom, 2 bath home on spacious lot Singlewide with additions and extra large garage with craft room. All appliances stay. Don't miss your chance to see this property on the northwest side of Callaway....
Callaway
According to statistics, the population in Callaway, NE amounts to 689, which shows growth 4% compared to the previous year. The median age of the city’s residents is 42. The average household income is $45,809, shifting growth 3% from the past year, and the average property value in Callaway, NE decline 0% to $98,300 throughout the year.
What is the Average Price of Apartments for Sale in Callaway, NE, 68825?
| Month | Median Price |
|---|---|
| Apr 2024 |
$324,474
|
| Mar 2024 |
$324,474
|
| Feb 2024 |
$324,474
|
| Jan 2024 |
$324,474
|
| Dec 2023 |
$234,220
|
| Nov 2023 |
$263,681
|
| Month | Median Price |
|---|---|
| Apr 2024 |
$337,869
|
| Mar 2024 |
$337,869
|
| Feb 2024 |
$337,869
|
| Jan 2024 |
$337,869
|
| Dec 2023 |
$261,900
|
| Nov 2023 |
$273,819
|
Household Income
The average household income in Callaway, NE grew from $44,375 to $45,809 in the past year. This data is an estimate based upon 273 households in Callaway, NE . The chart below presents how household income is distributed in Callaway, NE in comparison to the revenue allocation amid households nationally.
Property Value
According to data from last year, the average property value in Callaway, NE shifted from $98,500 to $98,300 throughout the year. The subsequent graph indicates the share of properties in the given price range in Callaway, NE in comparison to the median property value in the same price segment across the country. According to the data, the greatest share of Callaway, NE properties falls in the '$150,000 to $174,999' range, which is lower than the most significant median property across the country.
Property Taxes
One of the most important aspects for property owners is the amount of property taxes. This graph shows distribution of property taxes in Callaway, NE compared to median property taxes around the country. The prevalent amount of property taxes in Callaway, NE equals $2500, which is less than the national average.