Camden, AR 71701, USA apartments for sale
$275,000
$275,000
Available: Right Now
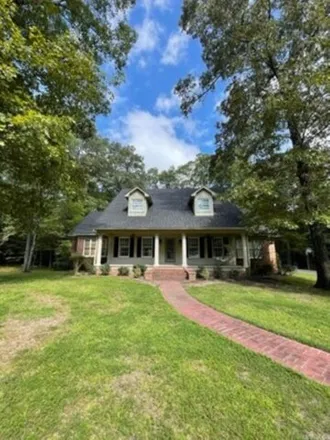
Welcome to your dream home! Nestled in a serene and quiet neighborhood, this exquisite 3 to 4 bedroom, 3 bathroom brick home is a testament to comfort, style, and functionality. From the moment you arrive, the charming curb appeal welcomes you, setti...
$145,000
$145,000
Available: Right Now
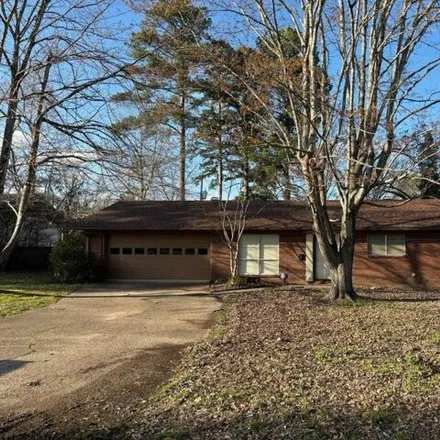
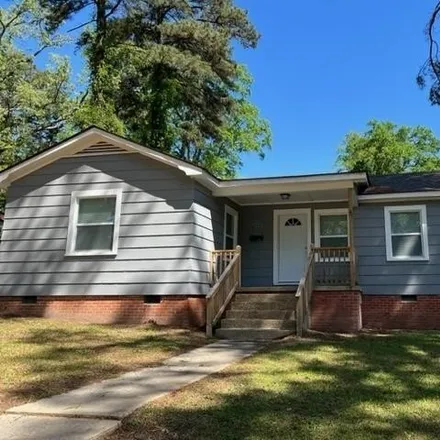
Introducing this charming three-bedroom, two-bathroom home located at the quiet end of North street. This property boasts a brand new roof, a modern heating and air conditioning unit, and energy-efficient windows that flood the interior with natural ...
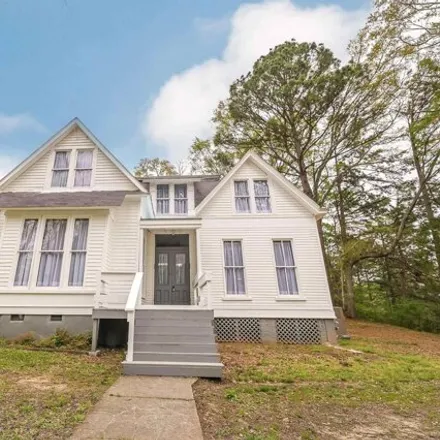
$289,500
$289,500
Available: Right Now
Introducing a truly grand property that seamlessly blends historic charm with modern comfort. This home extends a rare opportunity, designed with the versatility of a 5-door rental with shared living space and kitchen, or easily used as a single fami...
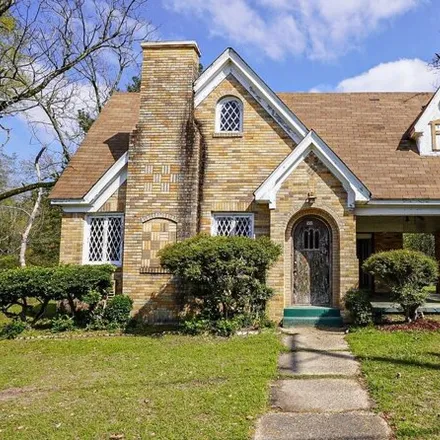
$55,000
$55,000
Available: Right Now
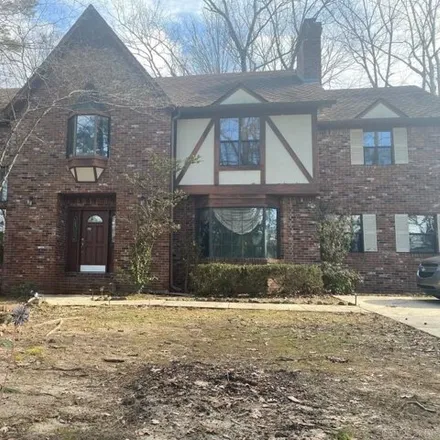
Here is your chance to own one of Camden's historic, brick homes! This charming Tudor-style house boasts original diamond patterned front windows along with the original arched front door! The spacious living room with a fire place and original oak f...
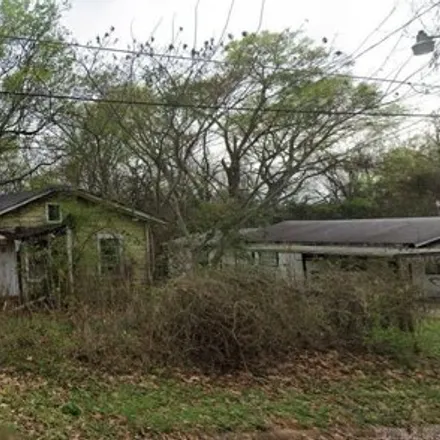
$9,500
$9,500
Available: Right Now
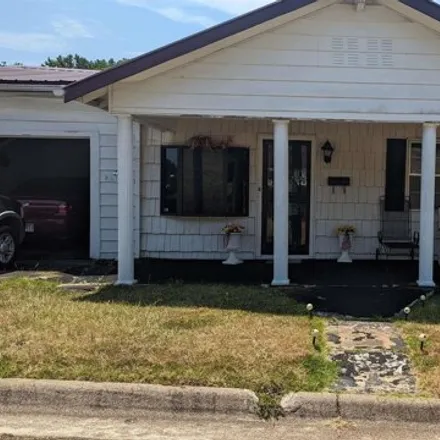
Owner-finance available! 10% discount for quick cash sale. Home will need renovations but you keep the equity once it's paid off. Home sits on a good sized corner lot and property taxes are low. Make this into your first starter home or fix quickly t...
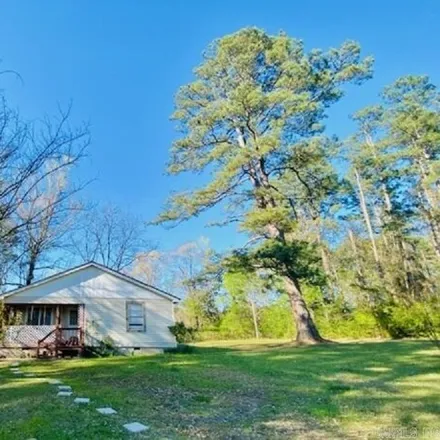
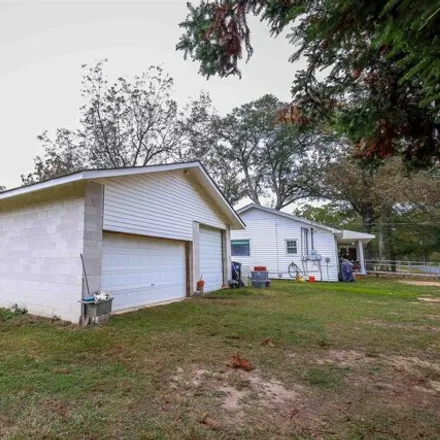
$69,900
$69,900
Available: Right Now
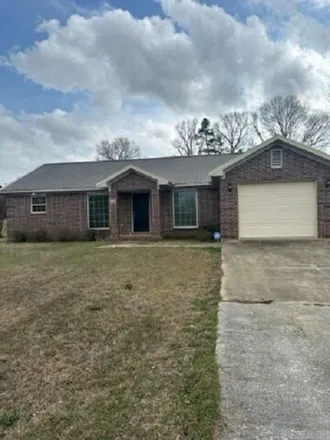
This property offers an excellent opportunity for a first time home buyer or savvy investor looking for a profitable rental property. Boasting2BR/1BAand situated on 1.83 acres of land outside city limits, this property also features utility hookups f...
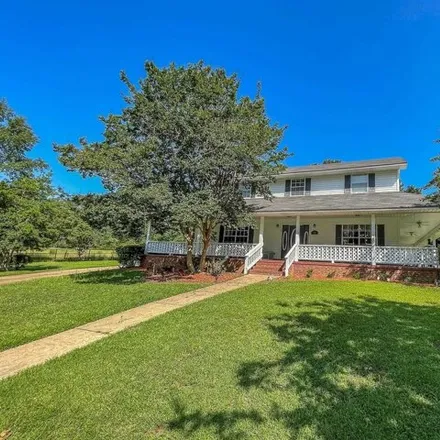
$272,500
$272,500
Available: Right Now
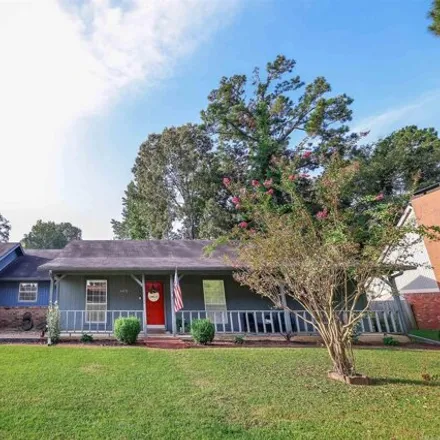
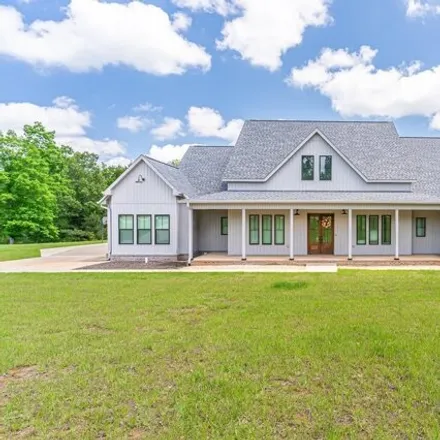
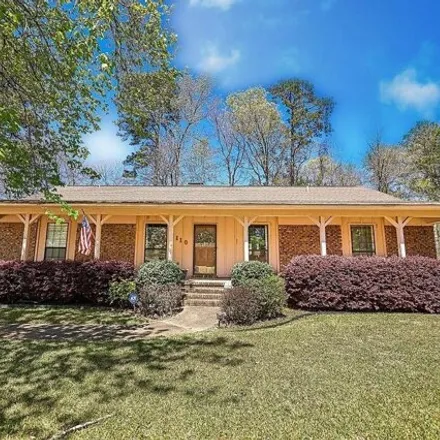
This is your chance to own this beautiful Camden home in the sought-after Fox Run Subdivision! The welcoming wrap-around porch, fresh color palette, spacious rooms, and open kitchen and dining area all add to the appeal of this quality home. Some ext...
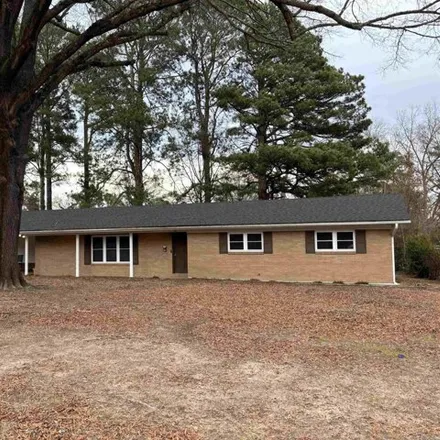
$159,000
$159,000
Available: Right Now
With it's thoughtful updates, spacious interior, and practical additions like a new roof and exterior storage, this property invites you to embrace a lifestyle of comfort and convenience. Don't miss out on the opportunity to make this charming brick ...
$218,500
$218,500
Available: Right Now
This one has it all! Located in the sought-after Fairview area, this warm and inviting home features an easy-flow floor plan with 3 bedrooms, 2 walk-in shower bathrooms, timeless vaulted ceiling and brick fireplace in the living room, plenty of count...
$425,000
$425,000
Available: Right Now
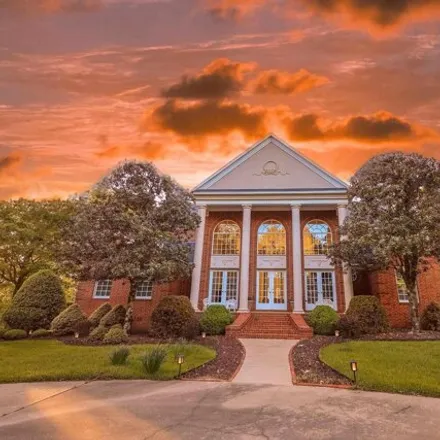
Beautiful 5-bedroom 3.5 bath home setting high on a hill with beautiful trees and a nice inground swimming pool. There are 2 primary bedrooms in this house. One of the primary bedrooms with a fireplace, walk-in closet and has its own huge on suite. T...
$189,000
$189,000
Available: Right Now
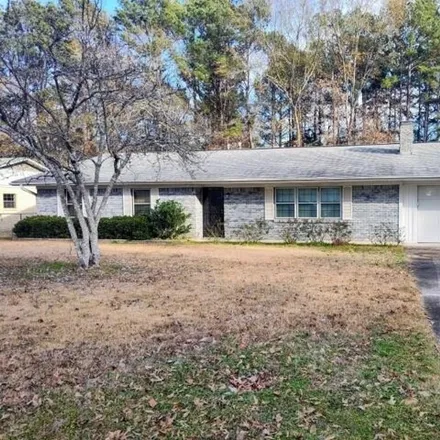
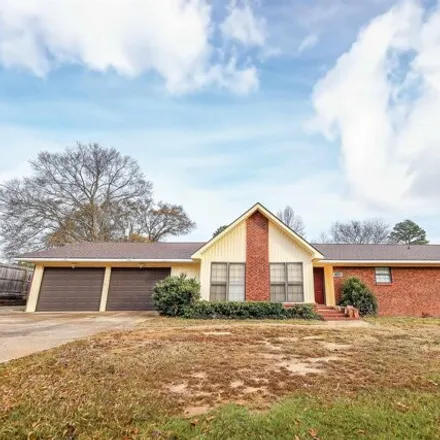
Welcome to this inviting 3-bedroom, 2-bathroom brick home, offering a comfortable and functional layout that's perfect for family living and entertaining. Step inside to discover two expansive living areas, including a spacious family room featuring ...
$112,500
$112,500
Available: Right Now
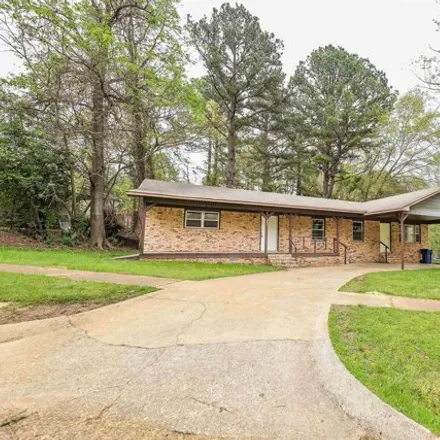
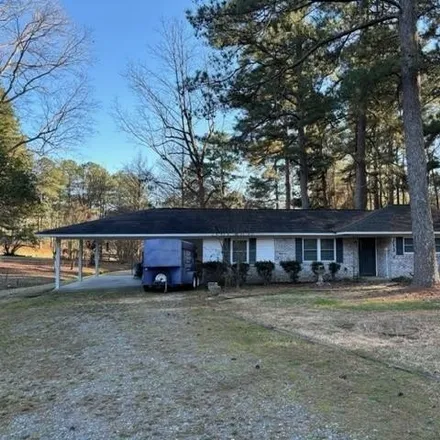
Perfect starter home! This brick home sitting on a corner lot has a fresh and welcoming interior. With an airy flow to the front rooms, and new flooring and fixtures to the bedrooms and bathrooms, this property is a neutral backdrop to accommodate a ...
$149,900
$149,900
Available: Right Now
Welcome to your cozy sanctuary nestled in the heart of Camden. This beautifully refurbished 3-bedroom, 2-bathroom cottage exudes timeless charm while boasting modern upgrades for ultimate comfort and convenience. Vintage Appeal, Modern Comfort: Exper...
$359,500
$359,500
Available: Right Now
This home is aMUST SEE!! A beautiful dead-end street with well kept lawns and lots of curb appeal. Large 2 acre lot with scenic views of the adjoining woods. Large formal living room and dining room flow into the sunken den with fireplace and french ...
$159,900
$159,900
Available: Right Now
Discover this 2 bed, 1.5 bath brick home on a serene lot, three ceiling fans with a single garage, metal roof and central heat/air, comfort meets durability. Neutral tile floors grace through out the open layout, seamlessly connecting living, dining ...
$179,000
$179,000
Available: Right Now
Charming Country Home with Golf Course View! Nestled on a spacious 0.86 acre lot, this beautiful 3 bedroom, 2 bath brick home offers the perfect blend of comfort and tranquility. Located in a peaceful countryside setting, the property features a fami...
$659,900
$659,900
Available: Right Now
Welcome to Market 3051 Comanche Avenue Camden, AR! This gorgeous home sits on 2.27 +/- acres. From the moment you pull into the driveway, this home will take your breath away. You will be welcomed by a large front porch perfect for having a morning c...
$749,500
$749,500
Available: Right Now
Beautiful custom home in Camden's coveted Stone Ridge neighborhood! This four bedroom, four and a half bathroom home sits on over 11 acres overlooking the beautiful Ouachita River Valley. Features include two full-size kitchens, a home office, media ...
$100,000
$100,000
Available: Right Now
Oversized lot, spacious family home with a bonus finished basement for your home business or exercise/hobby room. 3 bedrooms, 2.5 baths, nice hardwood floors, 3 sitting areas. The property is very well maintained and sits on a quiet corner. You must ...
$250,000
$250,000
Available: Right Now
Spacious Cherokee addition home with a neutral color pallet, yet just enough personality to make it a unique find! The well-planned layout includes generously proportioned rooms with natural light enhancing every area. Enjoy granite countertops and a...
$249,000
$249,000
Available: Right Now
Beautifully updated home tucked away in the Pine Hills Subdivision! Surrounded by forestry, this three bedroom and two bathroom home is a quiet retreat located conveniently near city amenities. The southern-style front porch welcomes you in to the la...
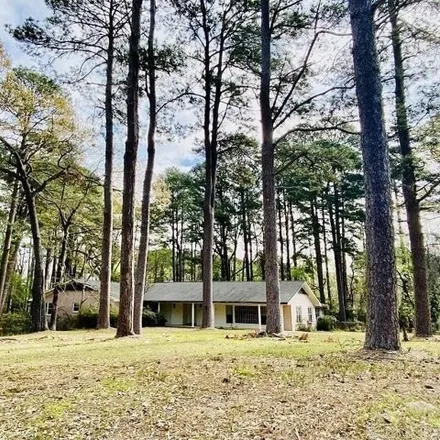
$284,900
$284,900
Available: Right Now
Discover your dream home at Elaine Estate, a spacious oasis with 4 bedrooms and 4 bath spread over an impressive4, 591sqft layout. Elaine Estate fuses classic charm and elegance, evident from the massive solid wood front door to a spacious kitchen wi...
Camden
According to statistics, the population in Camden, AR amounts to 11,289, which shows decline -2% compared to the previous year. The median age of the city’s residents is 39. The average household income is $25,234, shifting decline -1% from the past year, and the average property value in Camden, AR decline -2% to $69,700 throughout the year.
What is the Average Price of Apartments for Sale in Camden, AR, 71701?
| Month | Median Price |
|---|---|
| Apr 2024 |
$237,588
|
| Mar 2024 |
$237,588
|
| Feb 2024 |
$237,588
|
| Jan 2024 |
$237,588
|
| Dec 2023 |
$217,271
|
| Nov 2023 |
$249,561
|
| Month | Median Price |
|---|---|
| Apr 2024 |
$301,113
|
| Mar 2024 |
$301,113
|
| Feb 2024 |
$301,113
|
| Jan 2024 |
$301,113
|
| Dec 2023 |
$242,070
|
| Nov 2023 |
$210,112
|
Household Income
The average household income in Camden, AR declined from $25,581 to $25,234 in the past year. This data is an estimate based upon 4,484 households in Camden, AR . The chart below presents how household income is distributed in Camden, AR in comparison to the revenue allocation amid households nationally.
Property Value
According to data from last year, the average property value in Camden, AR shifted from $70,900 to $69,700 throughout the year. The subsequent graph indicates the share of properties in the given price range in Camden, AR in comparison to the median property value in the same price segment across the country. According to the data, the greatest share of Camden, AR properties falls in the '$40,000 to $49,999' range, which is higher than the most significant median property across the country.
Property Taxes
One of the most important aspects for property owners is the amount of property taxes. This graph shows distribution of property taxes in Camden, AR compared to median property taxes around the country. The prevalent amount of property taxes in Camden, AR equals $800, which is less than the national average.